The world of venture capital and private equity is defined by high stakes and intense competition. To succeed, analysts need to move faster and smarter than ever before. This playbook is a guide to leveraging cutting-edge AI to transform your workflow, from initial deal screening to long-term value creation. Below, we outline a series of plays that show how Patterns can automate routine tasks, uncover deeper insights, and free up your team to focus on what truly matters: making great investments.
01. Deal Triage
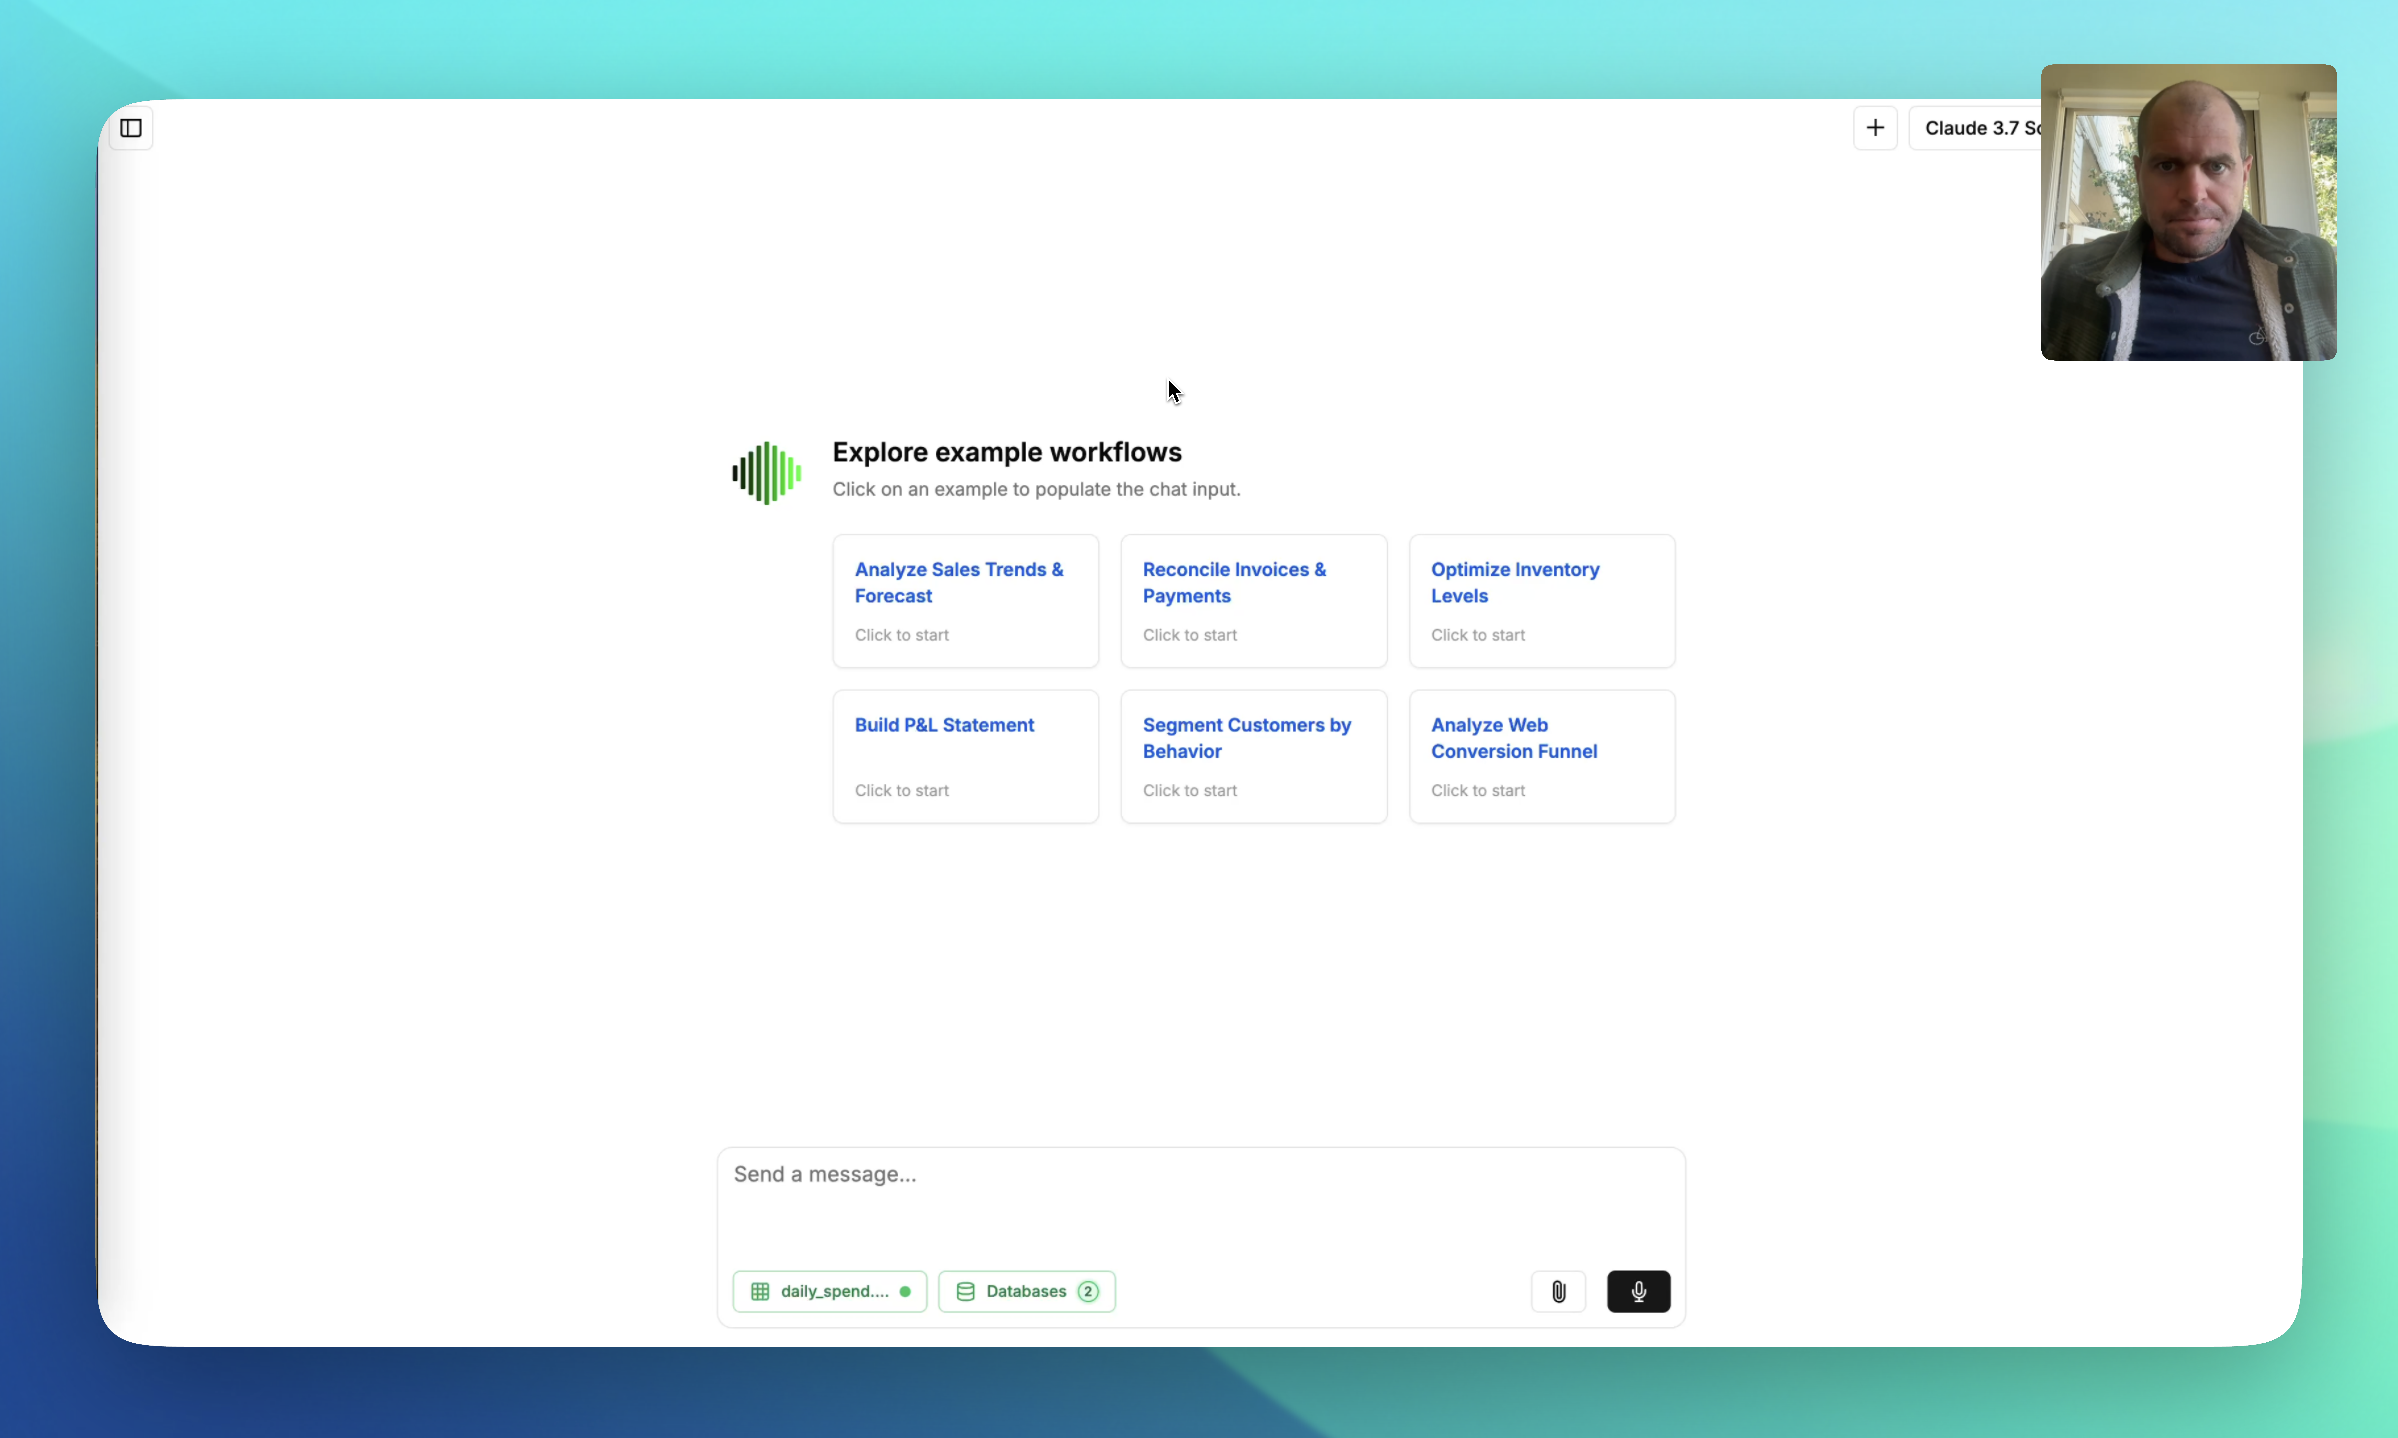
The initial phase of quickly evaluating a potential investment to determine if it merits deeper consideration. The goal is to move from a raw data room to a go/no-go decision with maximum speed and accuracy, leveraging your fund's unique perspective to surface the right opportunities.
Play 1.1: The 10-Minute Teaser Triage
Every investment firm runs the same initial screen: mandate fit, quick valuation check, strategic attractiveness, and red-flag hunt. Instead of analysts manually working through this checklist for each teaser, you upload the document to Patterns and prompt the AI to execute your fund's specific evaluation criteria from the Knowledge Base.
Scenario: Your mid-market fund (targeting $20-75M EBITDA, North American majority deals) receives a teaser for "Project Falcon" - a B2B software company. You upload the 2-page teaser and activate the "UMM Buyout Triage" knowledge card.
Knowledge Card: UMM Buyout Triage Criteria
- • Target sectors: Software, Healthcare IT, Industrial Tech
- • EBITDA range: $20-75M
- • Geography: North America only
- • Control requirement: Majority stake (>50%)
- • Target IRR: ≥20% net
- • Target MoIC: ≥2.5x
- • Max entry multiple: 12x EBITDA
- • Assumed leverage: 5.0x EBITDA
- • Market growth: ≥GDP growth rate
- • Market position: Top 3 player preferred
- • Customer concentration: No single customer >20%
- • Revenue quality: ≥60% recurring/subscription
- • Capex intensity: <5% of sales
- • Declining margins or growth rates
- • Customer churn mentions
- • Regulatory/litigation exposure
- • High cyclicality or seasonality
The Vega processes the teaser against each criterion, scores the opportunity, and generates a structured output with clear pass/fail decisions and highlighted concerns. Project Falcon passes mandate fit (B2B software, $45M EBITDA, US-based) but flags customer concentration risk (largest client represents 28% of revenue) and questions about churn rates buried in the growth narrative.
Play 1.2: Comparable Company Analysis & Market Intelligence
Project Falcon passed your triage. You've signed the NDA, received the 60-page CIM, and now need to build market conviction for your IOI submission. Instead of analysts manually scouring industry reports and Google searches, you prompt Vega to execute a comprehensive comparable company analysis and market mapping exercise leveraging deep web search capabilities, live Crunchbase integration, and your repository of uploaded PDF industry reports.
Scenario: With 2 weeks until IOI deadline, you need to validate Falcon's "leading B2B software platform" positioning and develop trading/transaction comps for valuation. Vega accesses proprietary databases, performs advanced web crawling beyond surface-level searches, and cross-references your uploaded industry reports from McKinsey, BCG, and Gartner to build comprehensive competitive intelligence and valuation benchmarks.
Vega performs deep web searches to uncover private company financials and competitive intelligence not available through standard search engines. It integrates live Crunchbase data to identify funding rounds, leadership changes, and acquisition activity across the competitive landscape. Cross-referencing with your uploaded industry reports, it sizes the TAM ($12B, growing 8% annually), maps 47 direct and indirect competitors (Falcon ranks #4 by revenue, #2 by growth rate), and builds comprehensive trading multiples and transaction comps. The analysis identifies 15 potential add-on targets and establishes valuation benchmarks with median EV/Revenue of 8.2x and EV/EBITDA of 24.5x for comparable SaaS platforms.
Advanced Data Sources Leveraged
Play 1.3: CIM to LBO Model in Minutes
While the market research runs, you need to build a full LBO model from the CIM financials to support your IOI valuation. Instead of manually transcribing financial statements and building sensitivity tables from scratch, you upload the CIM and activate your fund's "LBO Model Builder" knowledge card.
Scenario: The Falcon CIM contains 5 years of historical financials across multiple tabs, plus management projections. You need a base-case model with debt capacity analysis and sensitivity tables for your IC presentation.
Auto-Generated Model Components
The model shows Falcon can support 5.2x leverage at current EBITDA levels, generating a 22% IRR at 10x entry multiple. The sensitivity analysis reveals the deal works at growth rates as low as 12% (vs. management's 18% projection), providing downside protection for your IOI range of 9.5x-10.5x EBITDA.
02. Deep Due Diligence
Your IOI for Project Falcon was accepted. Now you have 6 weeks of exclusivity and full data room access to validate your investment thesis. This phase involves building robust financial models, verifying management claims, and stress-testing assumptions through expert interviews and customer references.
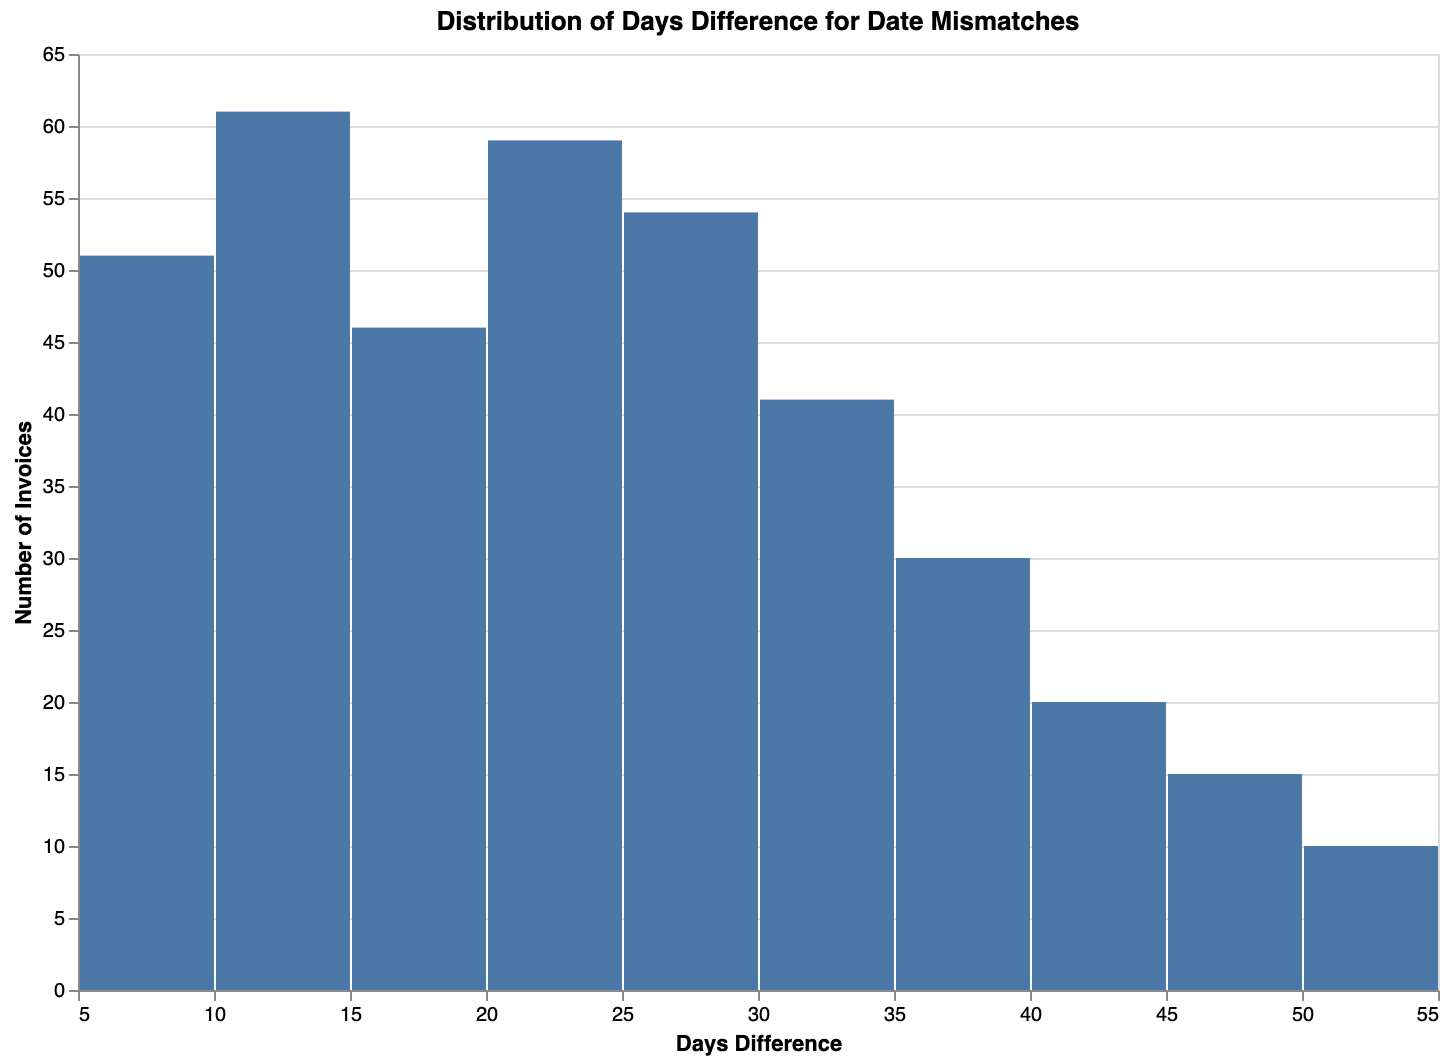
Play 2.1: Data Room to Quality of Earnings
The data room contains 500+ documents including 5 years of monthly financials, customer contracts, and operational reports. Instead of analysts spending weeks manually building QofE adjustments and working capital analysis, you connect Patterns directly to the data room. Vega processes general ledger details, identifies non-recurring items, and builds a comprehensive financial normalization.
Scenario: Falcon's data room includes QuickBooks exports, customer contract files, and expense detail by month. You need to validate the normalized $45M EBITDA claim and understand working capital dynamics for debt sizing.
QofE Analysis Output
The analysis reveals Falcon's true normalized EBITDA is $42.3M (not $45M), but confirms strong working capital conversion and low capex intensity. The Vega flags growing customer concentration as a key risk that wasn't fully disclosed in the CIM.
Play 2.2: Management Presentation Deep-Dive
Falcon's management team delivers a 40-slide presentation followed by 2 hours of Q&A. Instead of analysts manually taking notes and trying to cross-reference claims with data room documents, Vega processes the full presentation deck and call transcript to extract key insights, validate claims, and flag inconsistencies.
Scenario: Management claims 25% annual growth is sustainable based on new product launches and market expansion. You need to validate these claims against actual pipeline data and R&D investments found in the data room.
The Vega cross-references management's growth claims with data room evidence: R&D spending has increased 40% over 2 years, sales pipeline shows $12M in qualified opportunities, but customer churn has also increased from 8% to 12% annually. It identifies 3 specific inconsistencies between the presentation and underlying data.
Play 2.3: Expert & Customer Call Intelligence
Your team conducts 8 expert network calls and 12 customer reference interviews to validate market dynamics and customer satisfaction. Instead of manually synthesizing hours of transcripts, Vega processes all call recordings to extract key themes, identify consensus views, and flag outlier opinions that merit deeper investigation.
Scenario: Expert calls focus on B2B software market trends, while customer calls explore satisfaction, switching costs, and competitive alternatives. You need to synthesize insights across 20 hours of conversations to validate your investment thesis.
Key Insights Extracted
The analysis confirms strong market tailwinds and customer loyalty, but surfaces recent service quality concerns that weren't mentioned by management. This intelligence helps refine your final valuation and identify key operational improvements for the 100-day plan.
03. Value Creation
You've successfully acquired Project Falcon for $420M (10x normalized EBITDA). Now the real work begins: executing your 100-day plan to drive growth, optimize operations, and position for a successful exit. Vega becomes your portfolio monitoring and value creation engine.
Play 3.1: 100-Day Plan Execution Tracking
Your 100-day plan for Falcon includes 5 key initiatives: 8% price increase, customer success team expansion, two add-on acquisitions, cost reduction program, and new product launch. Instead of manually tracking progress across spreadsheets and status calls, you connect Patterns to Falcon's live systems to monitor execution in real-time.
Scenario: Day 45 post-closing. You need to track price increase rollout (targeting $3.4M annual impact), hiring progress (12 new customer success reps), and cost reduction savings (targeting $2M annually) for the upcoming board meeting.
100-Day Plan Dashboard - Day 45
The dashboard shows strong progress on pricing and hiring, but cost reduction is behind schedule. The Vega flags that 3 large customers are pushing back on price increases and recommends accelerating value-add services to justify pricing. This real-time insight allows course correction before the next board meeting.
Play 3.2: Automated Board Deck Generation
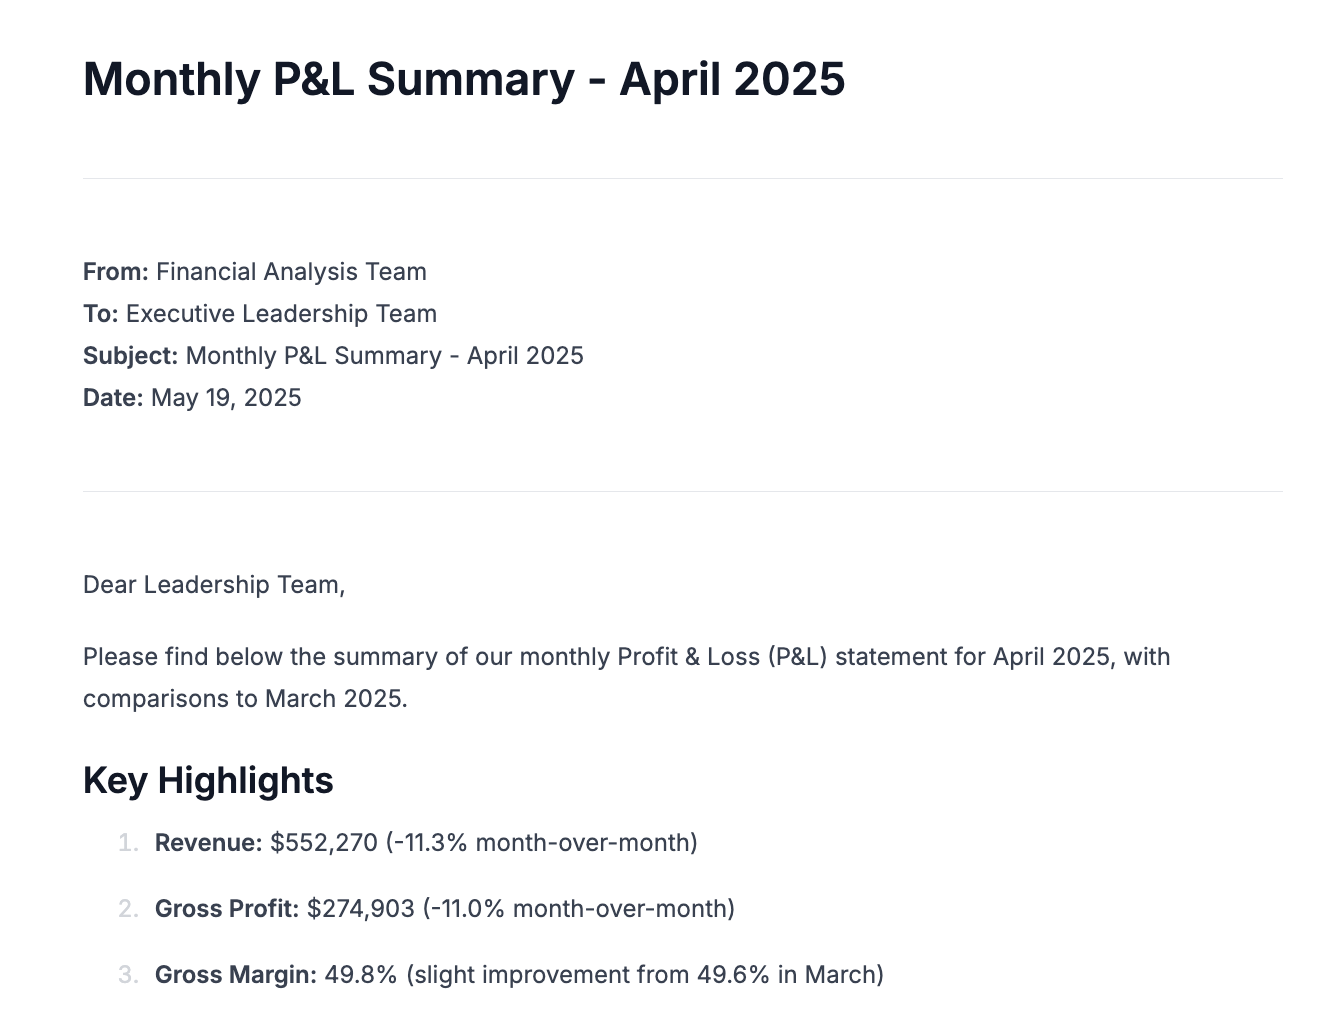
Falcon's board meets quarterly and expects a comprehensive performance update including financials, KPIs, market developments, and value creation progress. Instead of the CFO spending 3 days manually building slides and hunting for data, Vega automatically generates the board deck using live data connections and your standardized template.
Scenario: Q1 2025 board meeting is in 48 hours. You need a complete board deck with updated financials, 100-day plan progress, competitive intelligence, and forward-looking initiatives. The Vega should also prepare talking points for key discussion topics.
Auto-Generated Board Deck Contents
The 32-slide deck is generated in 15 minutes with current data, formatted charts, and pre-written talking points. The Vega also flags that customer acquisition cost has increased 15% and suggests this as a key discussion topic for operational improvements.
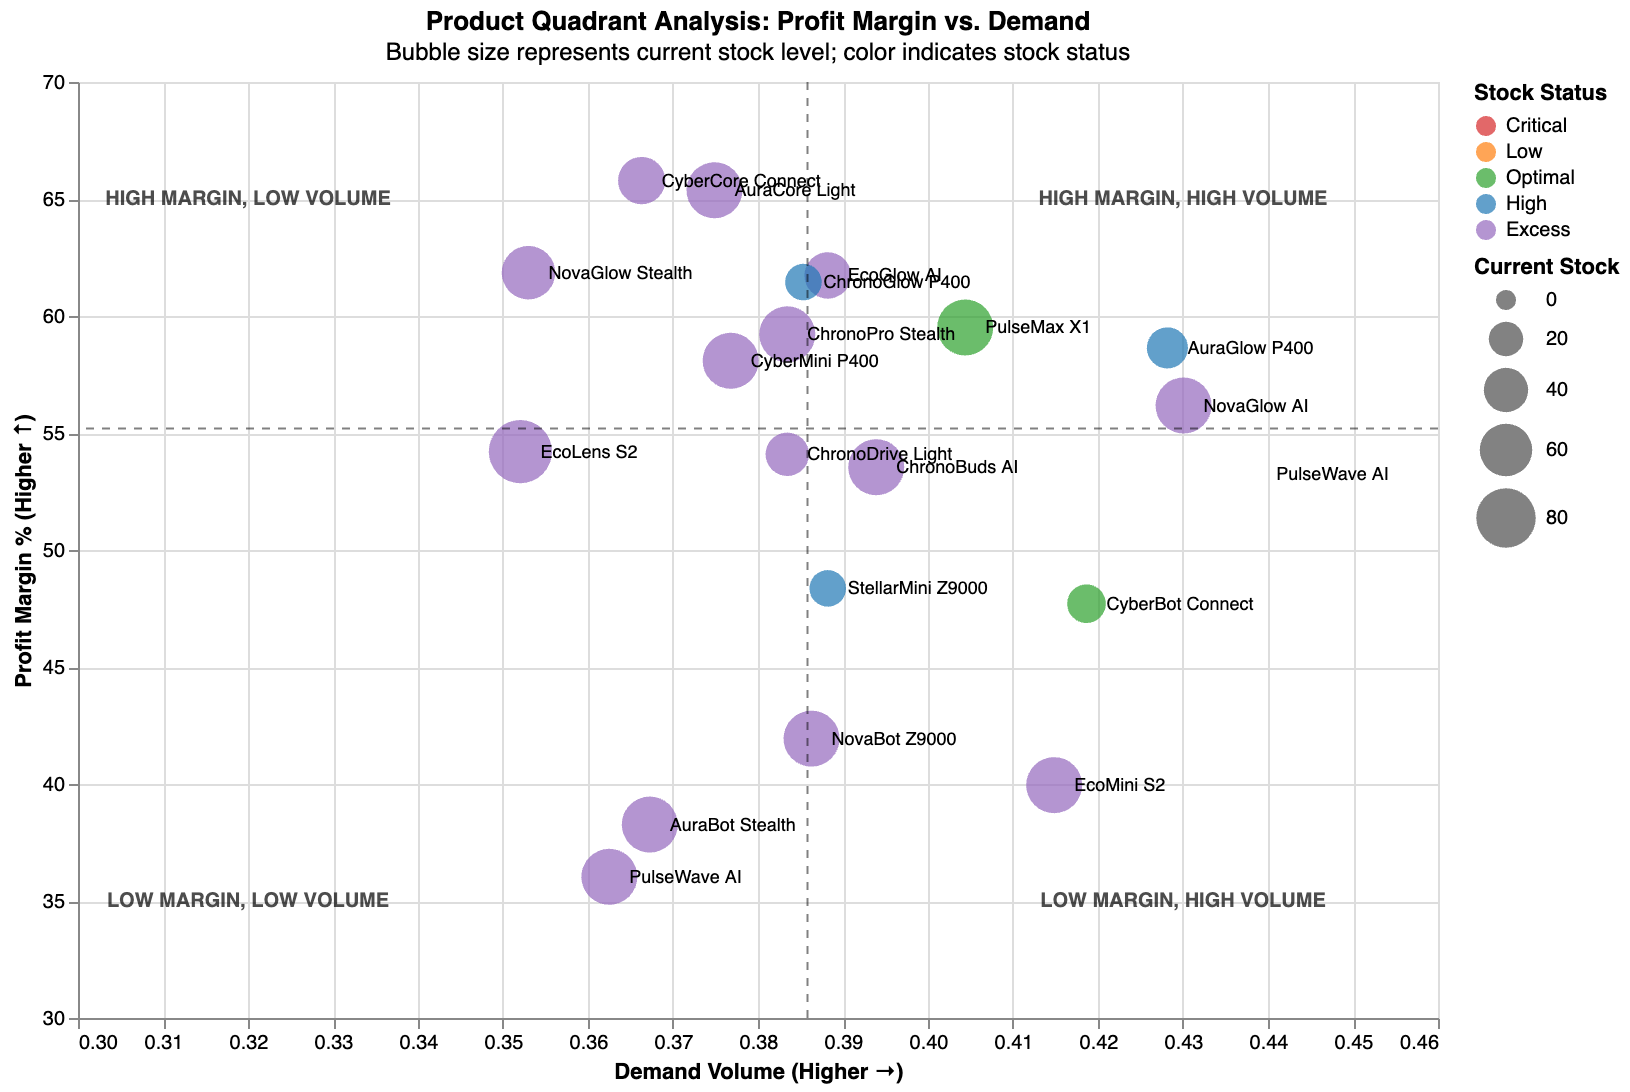
Play 3.3: Add-on Acquisition Pipeline
Your original investment thesis included building Falcon into a platform through strategic add-ons. You've identified 15 potential targets from your initial market mapping, but need to prioritize and track acquisition opportunities while managing integration planning. Vega helps you build and manage your add-on pipeline systematically.
Scenario: 18 months post-acquisition, you're ready to execute 2-3 add-ons before exit. You need to score targets by strategic fit, track outreach progress, and model accretion/dilution impact on exit valuation for different acquisition scenarios.
Add-on Pipeline Analysis
The analysis shows that acquiring DataFlow and SecureAPI would increase Falcon's total addressable market by 40% and create significant cross-selling opportunities. The Vega models various acquisition scenarios and recommends prioritizing DataFlow for its customer overlap and SecureAPI for its technical complementarity.