Introducing Patterns
A digital clone of your data team with GPT-4 built-in.
A digital clone of your data team with GPT-4 built-in.
Monthly revenue
1
10
11
12
2
3
4
5
6
7
8
9
Month
0
2,000,000
4,000,000
6,000,000
8,000,000
10,000,000
12,000,000
14,000,000
16,000,000
Revenue
2011
2012
2013
2014
Year
SELECT
EXTRACT(YEAR FROM orderdate) AS year,
EXTRACT(MONTH FROM orderdate) AS month,
SUM(totaldue) AS revenue
FROM
sales.salesorderheader
GROUP BY
year,
month
ORDER BY
year,
month
year
month
revenue
2011
5
567020.9498
2011
6
507096.4690
2011
7
2292182.8828
2011
8
2800576.1723
2011
9
554791.6082
2011
10
5156269.5291
2011
11
815313.0152
2011
12
1462448.8986
2012
1
4458337.4444
2012
2
1649051.9001
2012
3
3336347.4716
2012
4
1871923.5039
2012
5
3452924.4537
2012
6
4610647.2153
2012
7
3840231.4590
2012
8
2442451.1831
2012
9
3881724.1860
2012
10
2858060.1970
2012
11
2097153.1292
2012
12
3176848.1687
2013
1
2340061.5521
2013
2
2600218.8667
2013
3
3831605.9389
2013
4
2840711.1734
2013
5
3658084.9461
2013
6
5726265.2635
2013
7
5521840.8445
2013
8
3733973.0032
2013
9
5083505.3374
2013
10
5374375.9418
2013
11
3694667.9998
2013
12
4560577.0958
2014
1
4798027.8709
2014
2
1478213.2920
2014
3
8097036.3137
2014
4
1985886.1496
2014
5
6006183.2110
2014
6
54151.4785
What is Patterns?
Patterns amplifies your data experts, and makes it easier for you to understand and use your data.
With Patterns as your digital coworker, there's no need to navigate complicated tools. Add Quest-1 to email copy emailing or assign a task in Jira and get instant access to the insights you need. No more dashboard hunting, just effortless data access tailored to you.
With Patterns as your digital coworker, there's no need to navigate complicated tools. Add Quest-1 to email copy emailing or assign a task in Jira and get instant access to the insights you need. No more dashboard hunting, just effortless data access tailored to you.
Key feautures
powered by your data
Quest-1 is trained using verified queries and citations from real-world scenarios.
powered by your data
Quest-1 is trained using verified queries and citations from real-world scenarios.
powered by your data
Quest-1 is trained using verified queries and citations from real-world scenarios.
Expert SQL knowledge
Quest-1 can accurately retrieve and manipulate data from databases, saving time and effort for users who might not be proficient in SQL themselves.
Expert SQL knowledge
Quest-1 can accurately retrieve and manipulate data from databases, saving time and effort for users who might not be proficient in SQL themselves.
Expert SQL knowledge
Quest-1 can accurately retrieve and manipulate data from databases, saving time and effort for users who might not be proficient in SQL themselves.
data visualization
Transforming raw data into compelling visualizations using Vega-Lite.
data visualization
Transforming raw data into compelling visualizations using Vega-Lite.
data visualization
Transforming raw data into compelling visualizations using Vega-Lite.
reports and metrics
Capable of producing detailed reports, interpreting data trends, and exploring critical business questions to support strategic decision-making processes.
reports and metrics
Capable of producing detailed reports, interpreting data trends, and exploring critical business questions to support strategic decision-making processes.
reports and metrics
Capable of producing detailed reports, interpreting data trends, and exploring critical business questions to support strategic decision-making processes.
transparent analysis
Quest-1 offers audits and reruns for analyses, supported by thorough code documentation. This ensures clarity and consistency in all analytical tasks.
transparent analysis
Quest-1 offers audits and reruns for analyses, supported by thorough code documentation. This ensures clarity and consistency in all analytical tasks.
transparent analysis
Quest-1 offers audits and reruns for analyses, supported by thorough code documentation. This ensures clarity and consistency in all analytical tasks.
human support
Users receive accurate and reliable assistance of human experts when AI encounters uncertainties or challenges beyond its capabilities.
human support
Users receive accurate and reliable assistance of human experts when AI encounters uncertainties or challenges beyond its capabilities.
human support
Users receive accurate and reliable assistance of human experts when AI encounters uncertainties or challenges beyond its capabilities.
How it works?
How it works?
How it works?
01
01
Connect your database and activate tables to enable Patterns to understand your business context
Connect your database and activate tables to enable Patterns to understand your business context
02
02
Simply make a request, and Patterns will search its knowledge base to generate a response: SQL, charting code or plain text
Simply make a request, and Patterns will search its knowledge base to generate a response: SQL, charting code or plain text
Query
Data
Chart
#
1
2
3
4
5
6
7
8
9
10
11
12
13
14
15
16
17
18
19
20
21
22
23
24
25
26
27
28
29
30
31
32
33
34
35
36
37
38
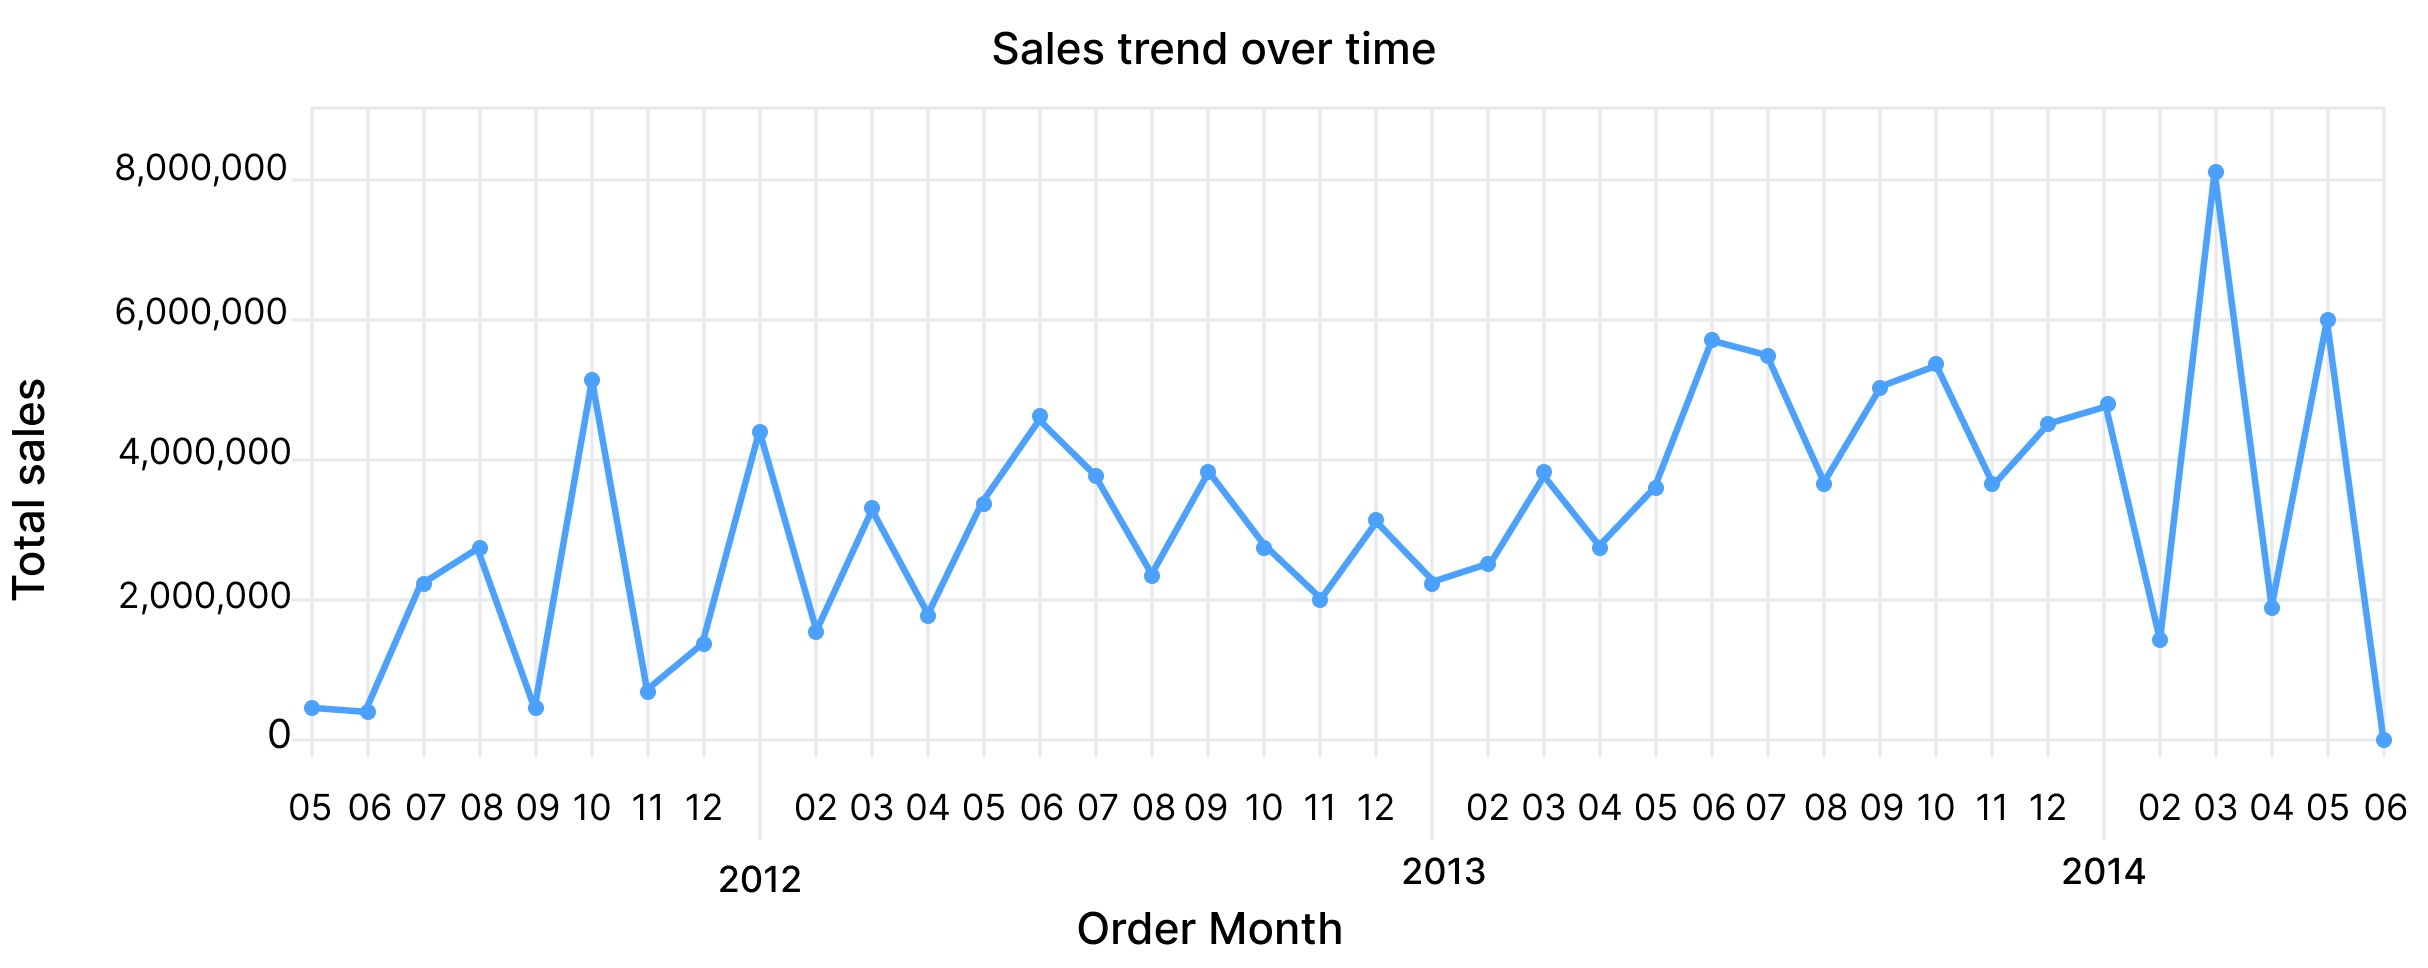
order_month
2011-05-01 00:00:00
2011-06-01 00:00:00
2011-07-01 00:00:00
2011-08-01 00:00:00
2011-09-01 00:00:00
2011-10-01 00:00:00
2011-11-01 00:00:00
2011-12-01 00:00:00
2012-01-01 00:00:00
2012-02-01 00:00:00
2012-03-01 00:00:00
2012-04-01 00:00:00
2012-05-01 00:00:00
2012-06-01 00:00:00
2012-07-01 00:00:00
2012-08-01 00:00:00
2012-09-01 00:00:00
2012-10-01 00:00:00
2012-11-01 00:00:00
2012-12-01 00:00:00
2013-01-01 00:00:00
2013-02-01 00:00:00
2013-03-01 00:00:00
2013-04-01 00:00:00
2013-05-01 00:00:00
2013-06-01 00:00:00
2013-07-01 00:00:00
2013-08-01 00:00:00
2013-09-01 00:00:00
2013-10-01 00:00:00
2013-11-01 00:00:00
2013-12-01 00:00:00
2014-01-01 00:00:00
2014-02-01 00:00:00
2014-03-01 00:00:00
2014-04-01 00:00:00
2014-05-01 00:00:00
2014-06-01 00:00:00
total_sales
567020.9498
507096.4690
2292182.8828
2800576.1723
554791.6082
5156269.5291
815313.0152
1462448.8986
4458337.4444
1649051.9001
3336347.4716
1871923.5039
3452924.4537
4610647.2153
3840231.4590
2442451.1831
3881724.1860
2858060.1970
2097153.1292
3176848.1687
2340061.5521
2600218.8667
3831605.9389
2840711.1734
3658084.9461
5726265.2635
5521840.8445
3733973.0032
5083505.3374
5374375.9418
3694667.9998
4560577.0958
4798027.8709
1478213.2920
8097036.3137
1985886.1496
6006183.2110
54151.4785
SELECT
DATE_TRUNC('month', orderdate) AS order_month,
SUM(totaldue) AS total_sales
FROM
sales.salesorderheader
GROUP BY
order_month
ORDER BY
order_month
Query
Data
Chart
#
1
2
3
4
5
6
7
8
9
10
11
12
13
14
15
16
17
18
19
20
21
22
23
24
25
26
27
28
29
30
31
32
33
34
35
36
37
38
order_month
2011-05-01 00:00:00
2011-06-01 00:00:00
2011-07-01 00:00:00
2011-08-01 00:00:00
2011-09-01 00:00:00
2011-10-01 00:00:00
2011-11-01 00:00:00
2011-12-01 00:00:00
2012-01-01 00:00:00
2012-02-01 00:00:00
2012-03-01 00:00:00
2012-04-01 00:00:00
2012-05-01 00:00:00
2012-06-01 00:00:00
2012-07-01 00:00:00
2012-08-01 00:00:00
2012-09-01 00:00:00
2012-10-01 00:00:00
2012-11-01 00:00:00
2012-12-01 00:00:00
2013-01-01 00:00:00
2013-02-01 00:00:00
2013-03-01 00:00:00
2013-04-01 00:00:00
2013-05-01 00:00:00
2013-06-01 00:00:00
2013-07-01 00:00:00
2013-08-01 00:00:00
2013-09-01 00:00:00
2013-10-01 00:00:00
2013-11-01 00:00:00
2013-12-01 00:00:00
2014-01-01 00:00:00
2014-02-01 00:00:00
2014-03-01 00:00:00
2014-04-01 00:00:00
2014-05-01 00:00:00
2014-06-01 00:00:00
total_sales
567020.9498
507096.4690
2292182.8828
2800576.1723
554791.6082
5156269.5291
815313.0152
1462448.8986
4458337.4444
1649051.9001
3336347.4716
1871923.5039
3452924.4537
4610647.2153
3840231.4590
2442451.1831
3881724.1860
2858060.1970
2097153.1292
3176848.1687
2340061.5521
2600218.8667
3831605.9389
2840711.1734
3658084.9461
5726265.2635
5521840.8445
3733973.0032
5083505.3374
5374375.9418
3694667.9998
4560577.0958
4798027.8709
1478213.2920
8097036.3137
1985886.1496
6006183.2110
54151.4785
SELECT
DATE_TRUNC('month', orderdate) AS order_month,
SUM(totaldue) AS total_sales
FROM
sales.salesorderheader
GROUP BY
order_month
ORDER BY
order_month
03
03
Save and share analyses effortlessly, complete with contextual summaries and insights
Save and share analyses effortlessly, complete with contextual summaries and insights
04
04
Stay ahead with future developments, including more interfaces, deep-dive analysis, and proactive engagement
Stay ahead with future developments, including more interfaces, deep-dive analysis, and proactive engagement
Customizing Patterns
Patterns is a flexible tool designed for customization.
When you link your database and choose tables, Patterns learns about your business by automatically analyzing your data and query history. You can further tailor its performance by adding your own context, for example to create specialized bots for specific teams within large enterprises, such as marketing or sales.
When you link your database and choose tables, Patterns learns about your business by automatically analyzing your data and query history. You can further tailor its performance by adding your own context, for example to create specialized bots for specific teams within large enterprises, such as marketing or sales.