AI Flight Patterns
March 29, 2023
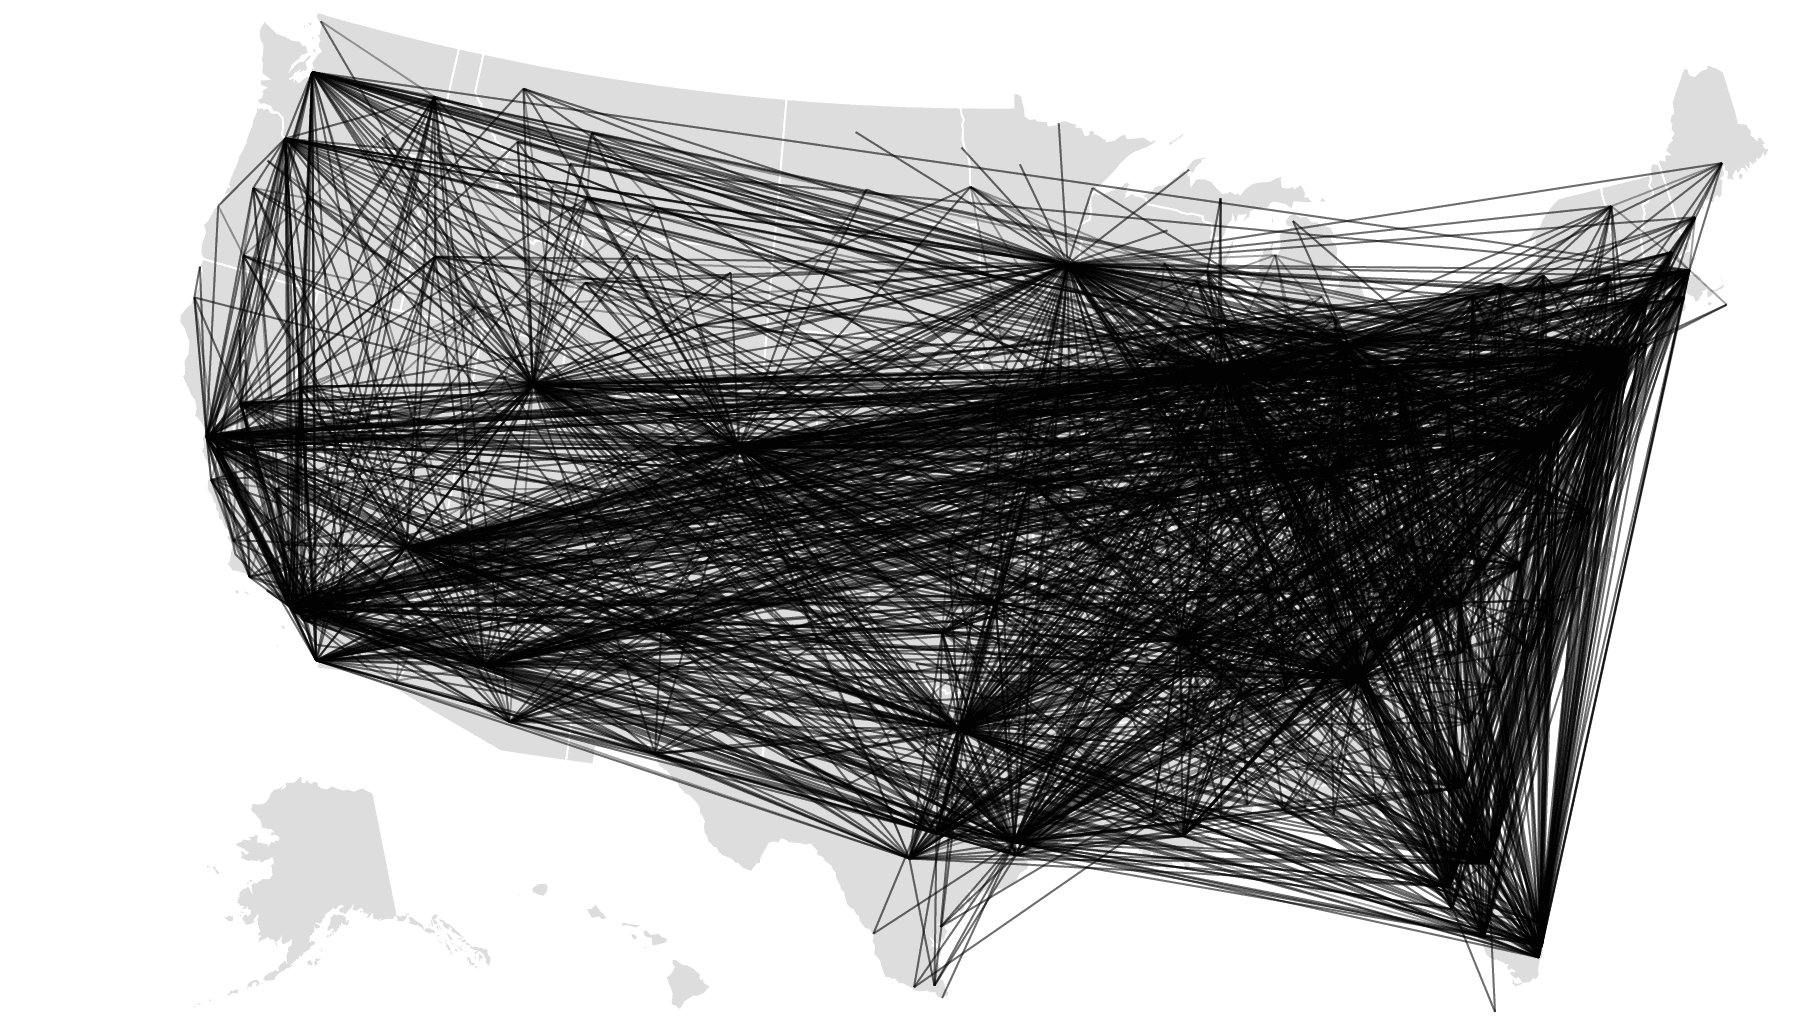
More than 45,000 commercial airline flights cross the United States each day. Aaron Koblin and several of his colleagues at UCLA began to visualize U.S. Federal Aviation Administration (FAA) flight data in 2005 using the Processing open source software sketchbook. They mapped the flight routes from departure airport to flight destination. Aaron Koblin’s Flight Patterns visualizations have appeared in several museums and in the documentary film The Human Face of Big Data.
Twenty years later, we are experiencing a new generation of AI for data analytics and AI data visualization. With Patterns.app, we can instruct the AI to generate visualizations and answer natural language questions. In this article, I’ll show my AI prompts to explore U.S. Department of Transportation flight data using Patterns.app.
Aaron Koblin Flight Patterns

Introduction to Patterns
At Patterns.app, you can request access to a free 30 day Patterns trial to explore sample data, create visualizations, and ask natural language questions.
You will begin with this simple interface.
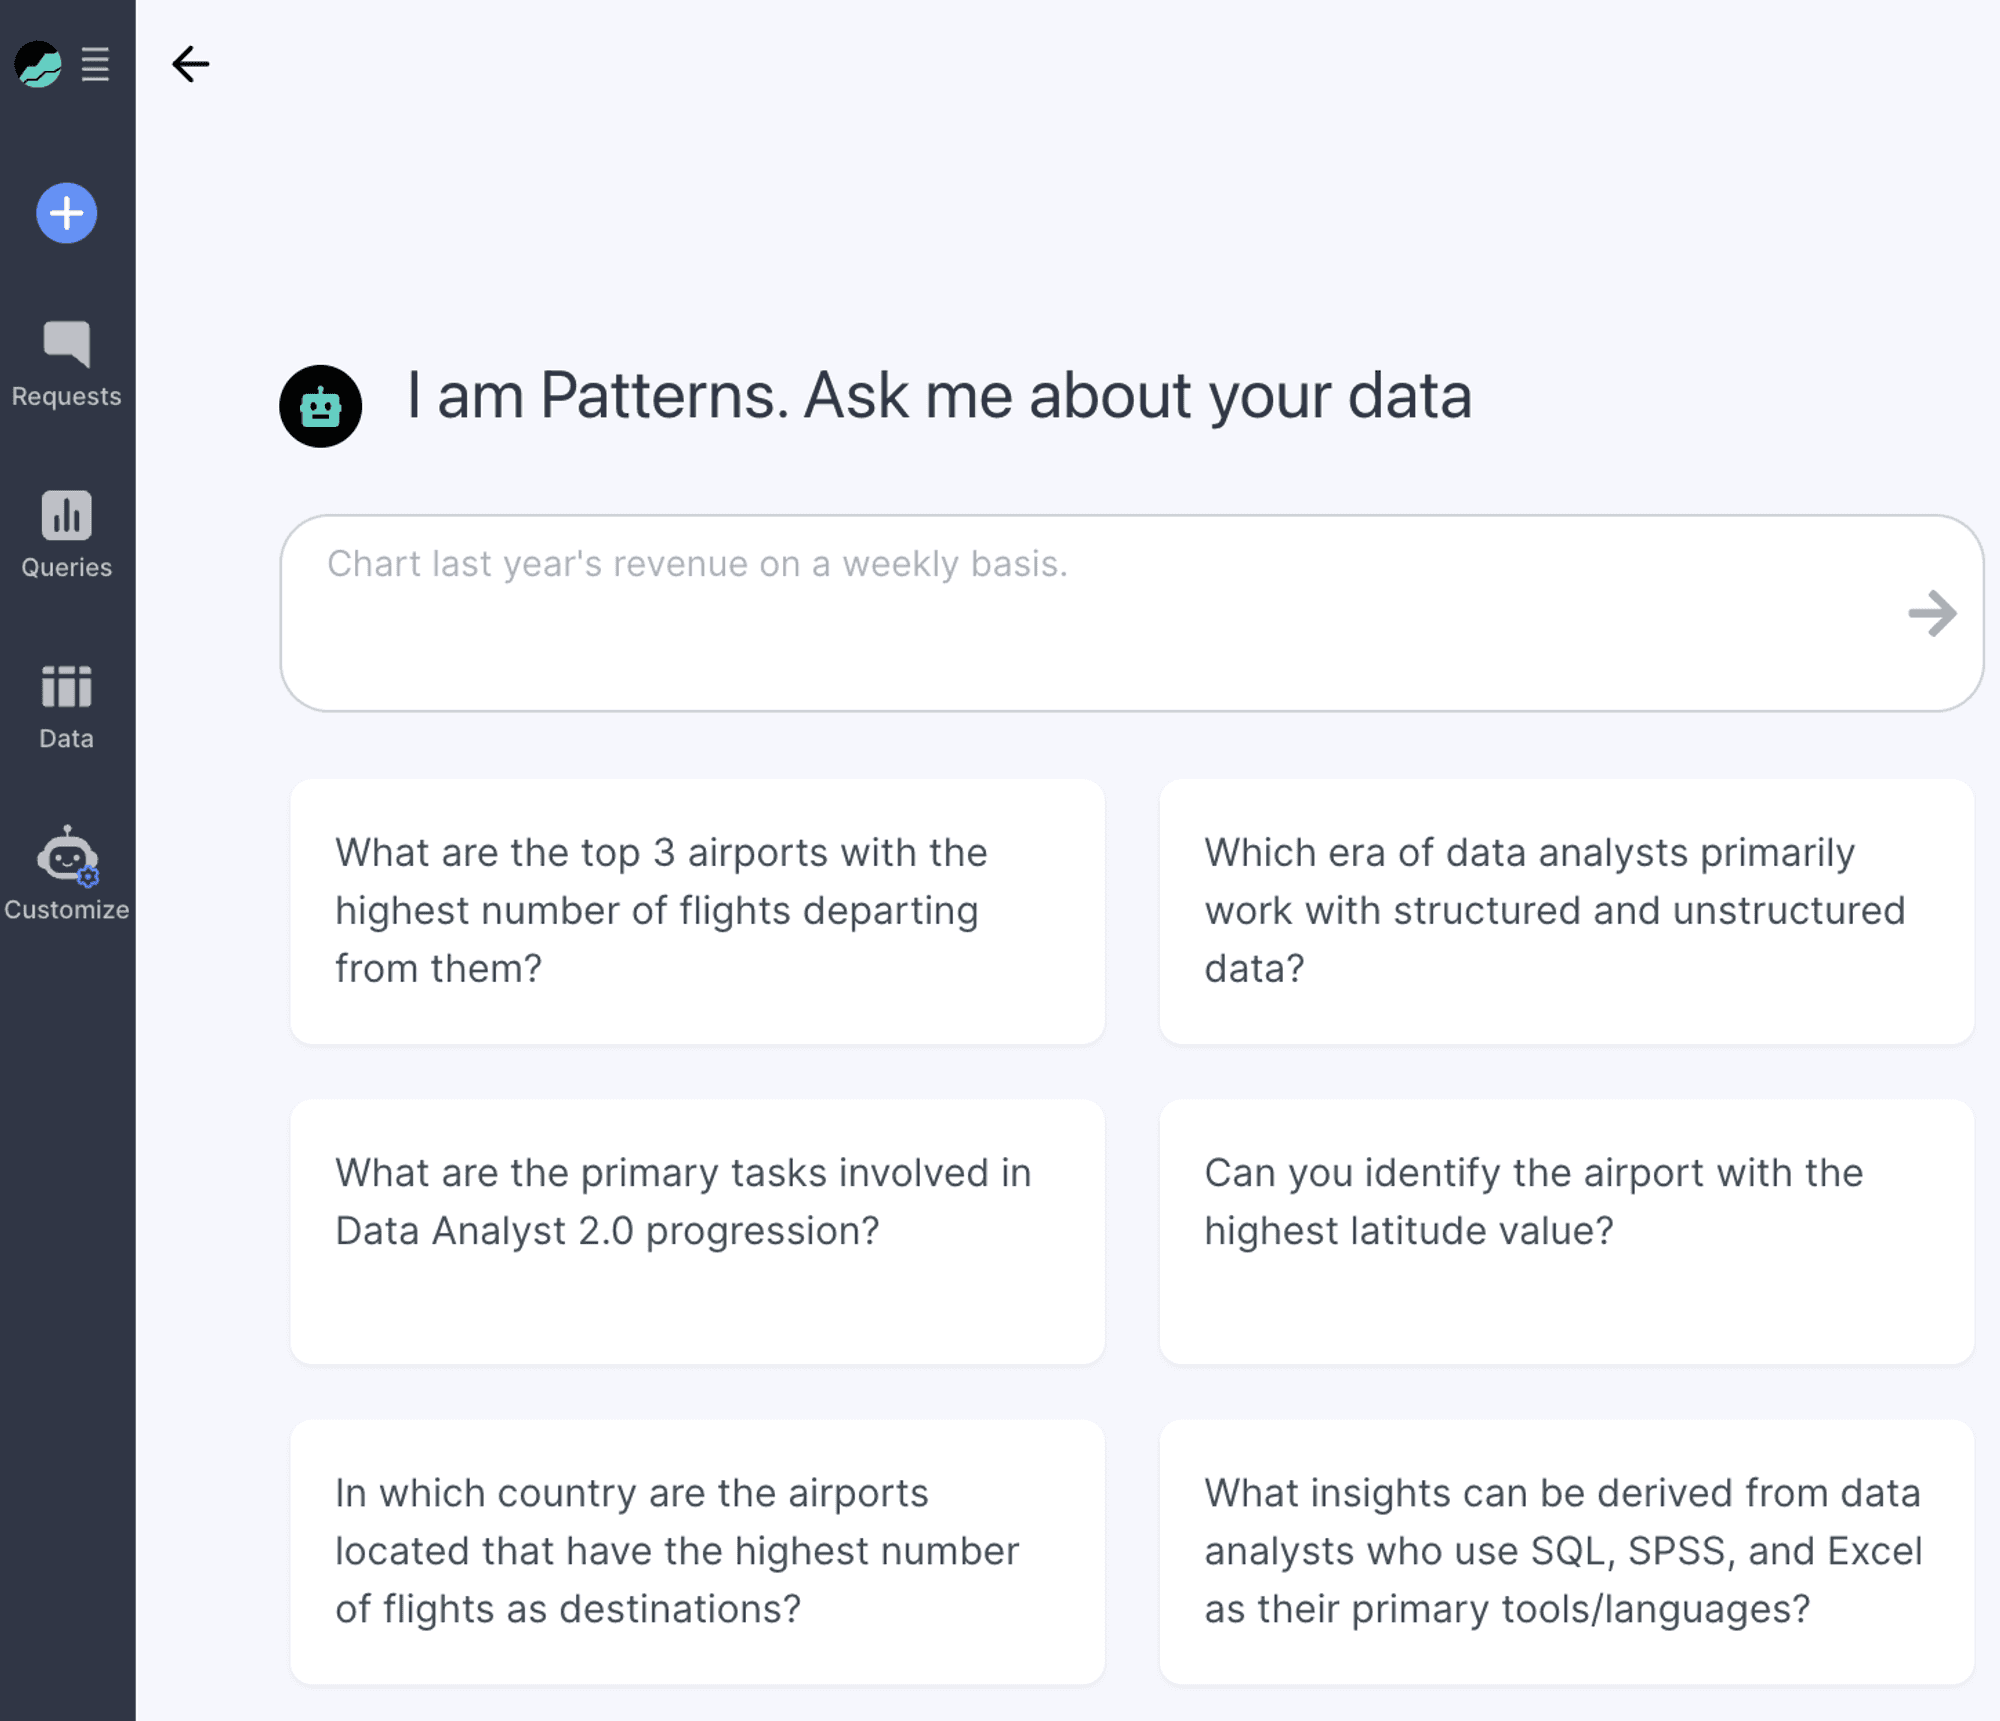
To start, you can type “Chart the flight departure cities and flight arrival cities with a line representing each flight for the continental United States.”
When you click return, the Patterns bot explains the steps that it takes:
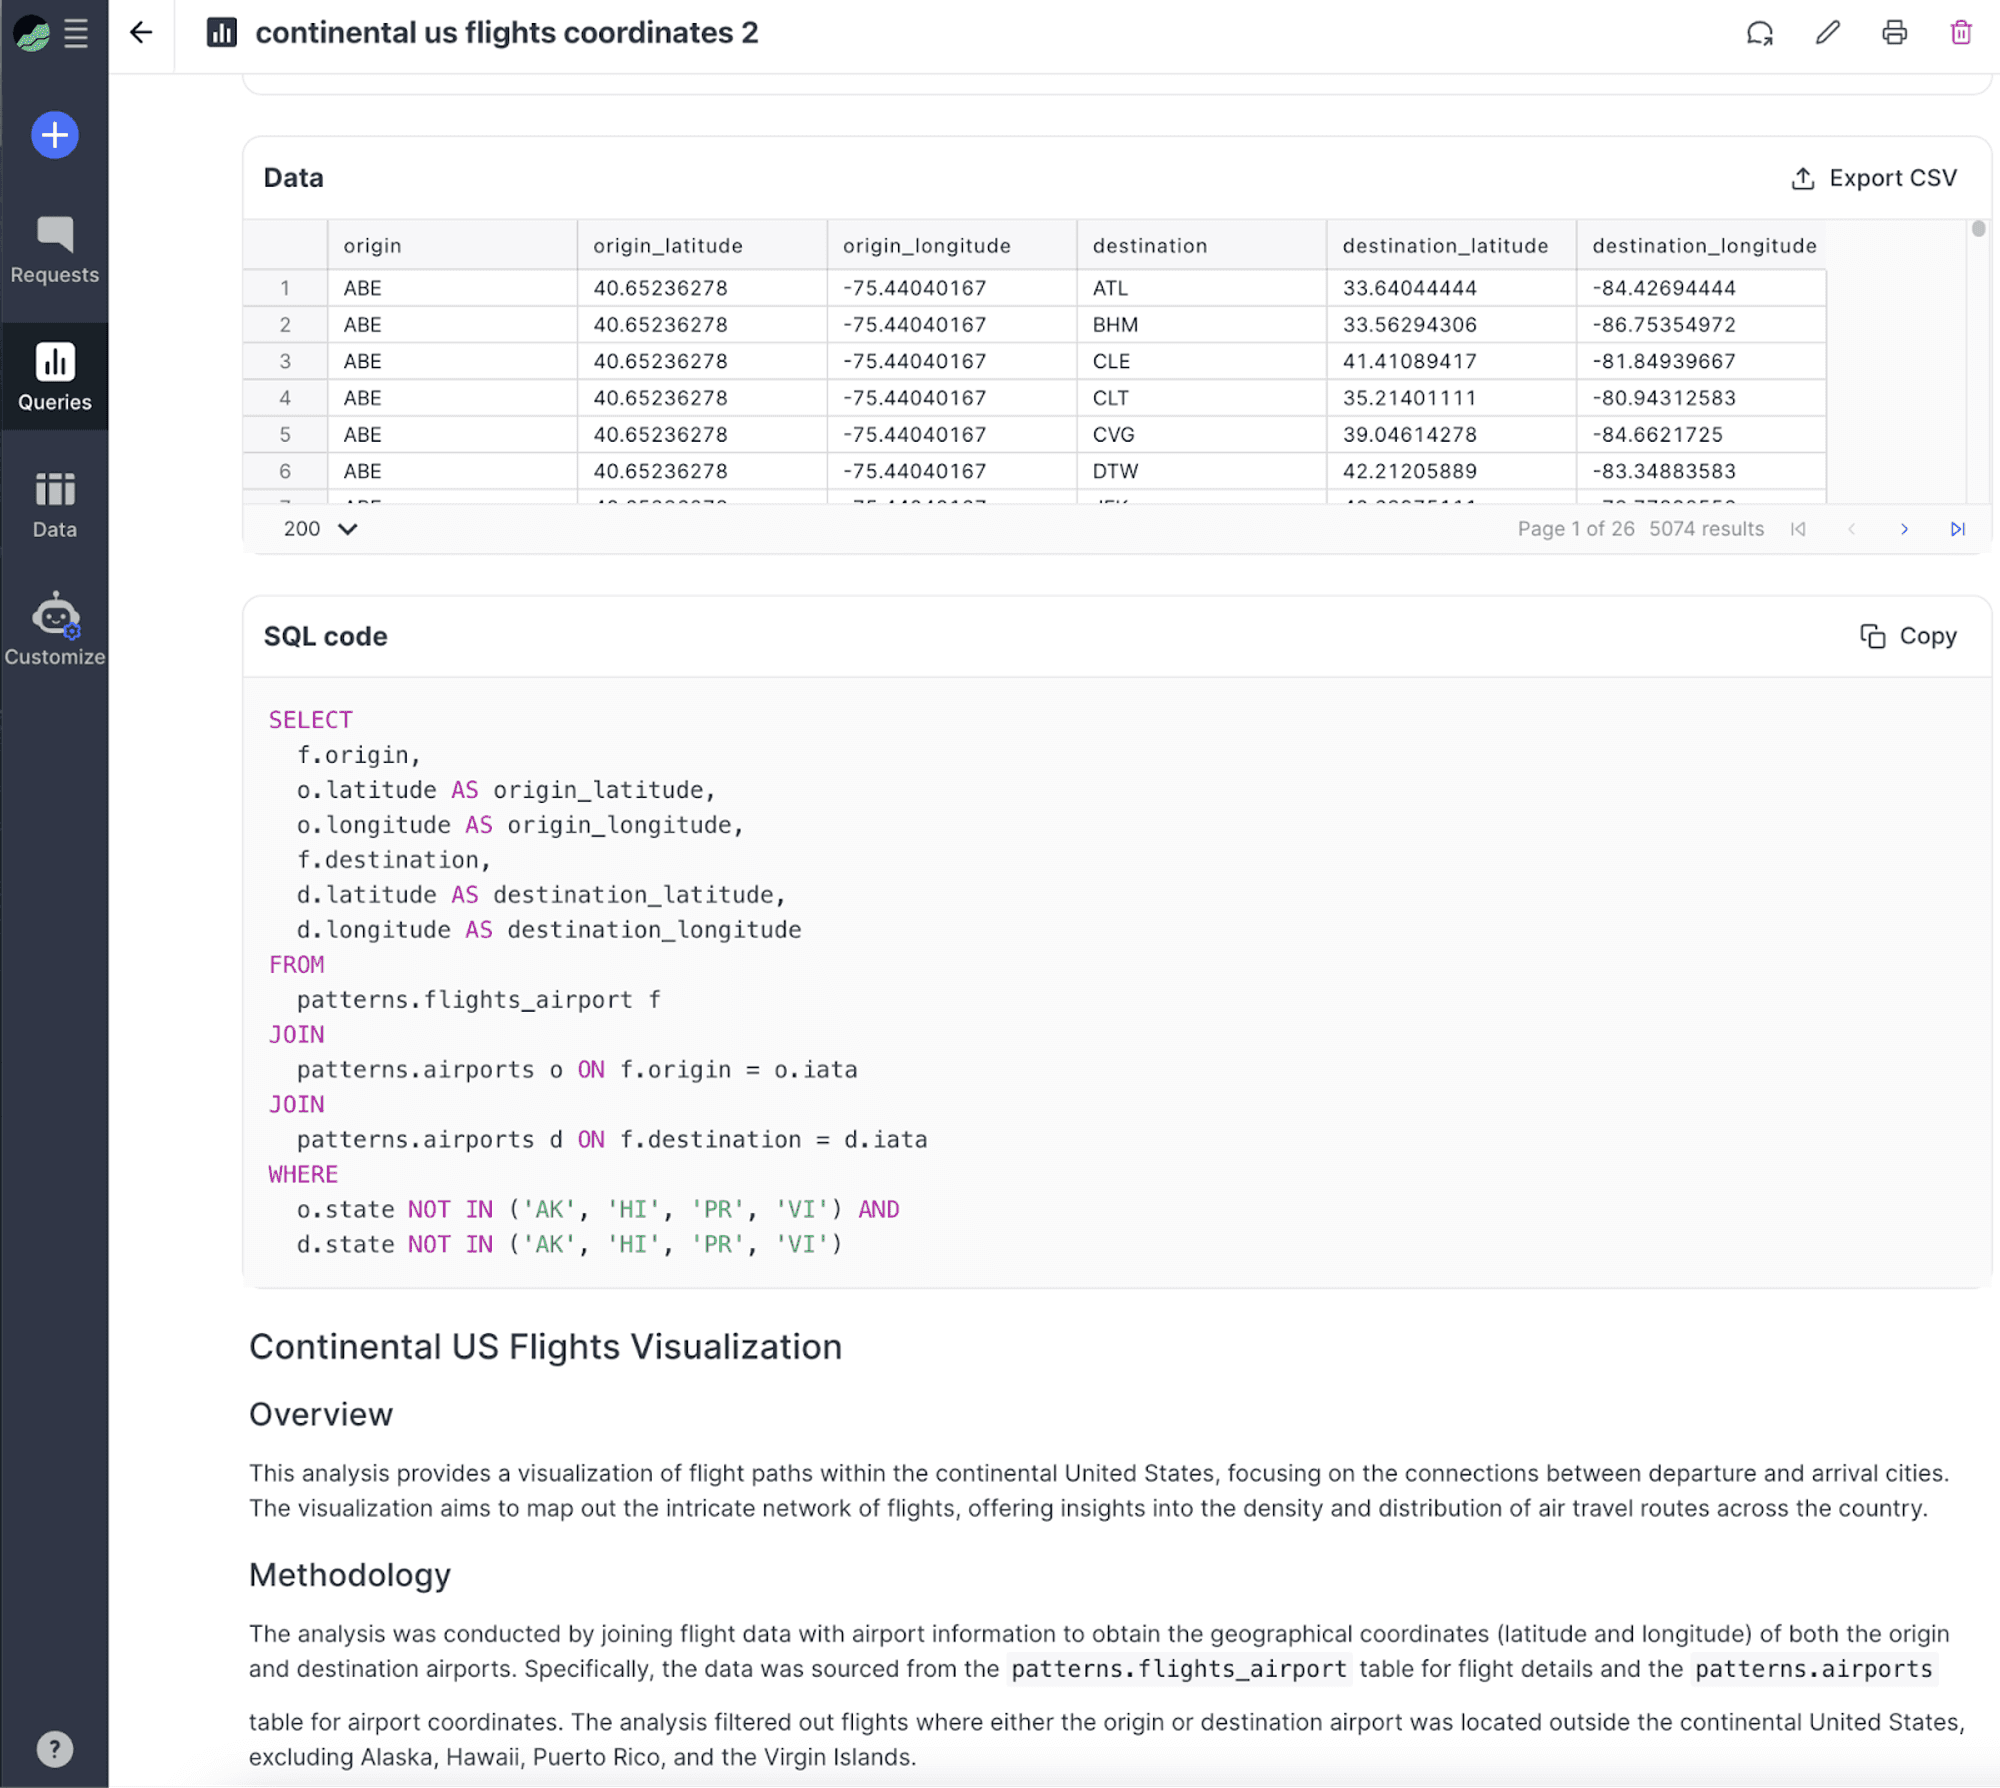
Join the patterns.flights_airport table with the patterns.airports table twice: once for the origin (departure) city and once for the destination (arrival) city.
Filter out flights that originate or terminate outside the continental United States.
Use the latitude and longitude for both origin and destination to draw lines representing each flight.
Within seconds you will see the following visualization:
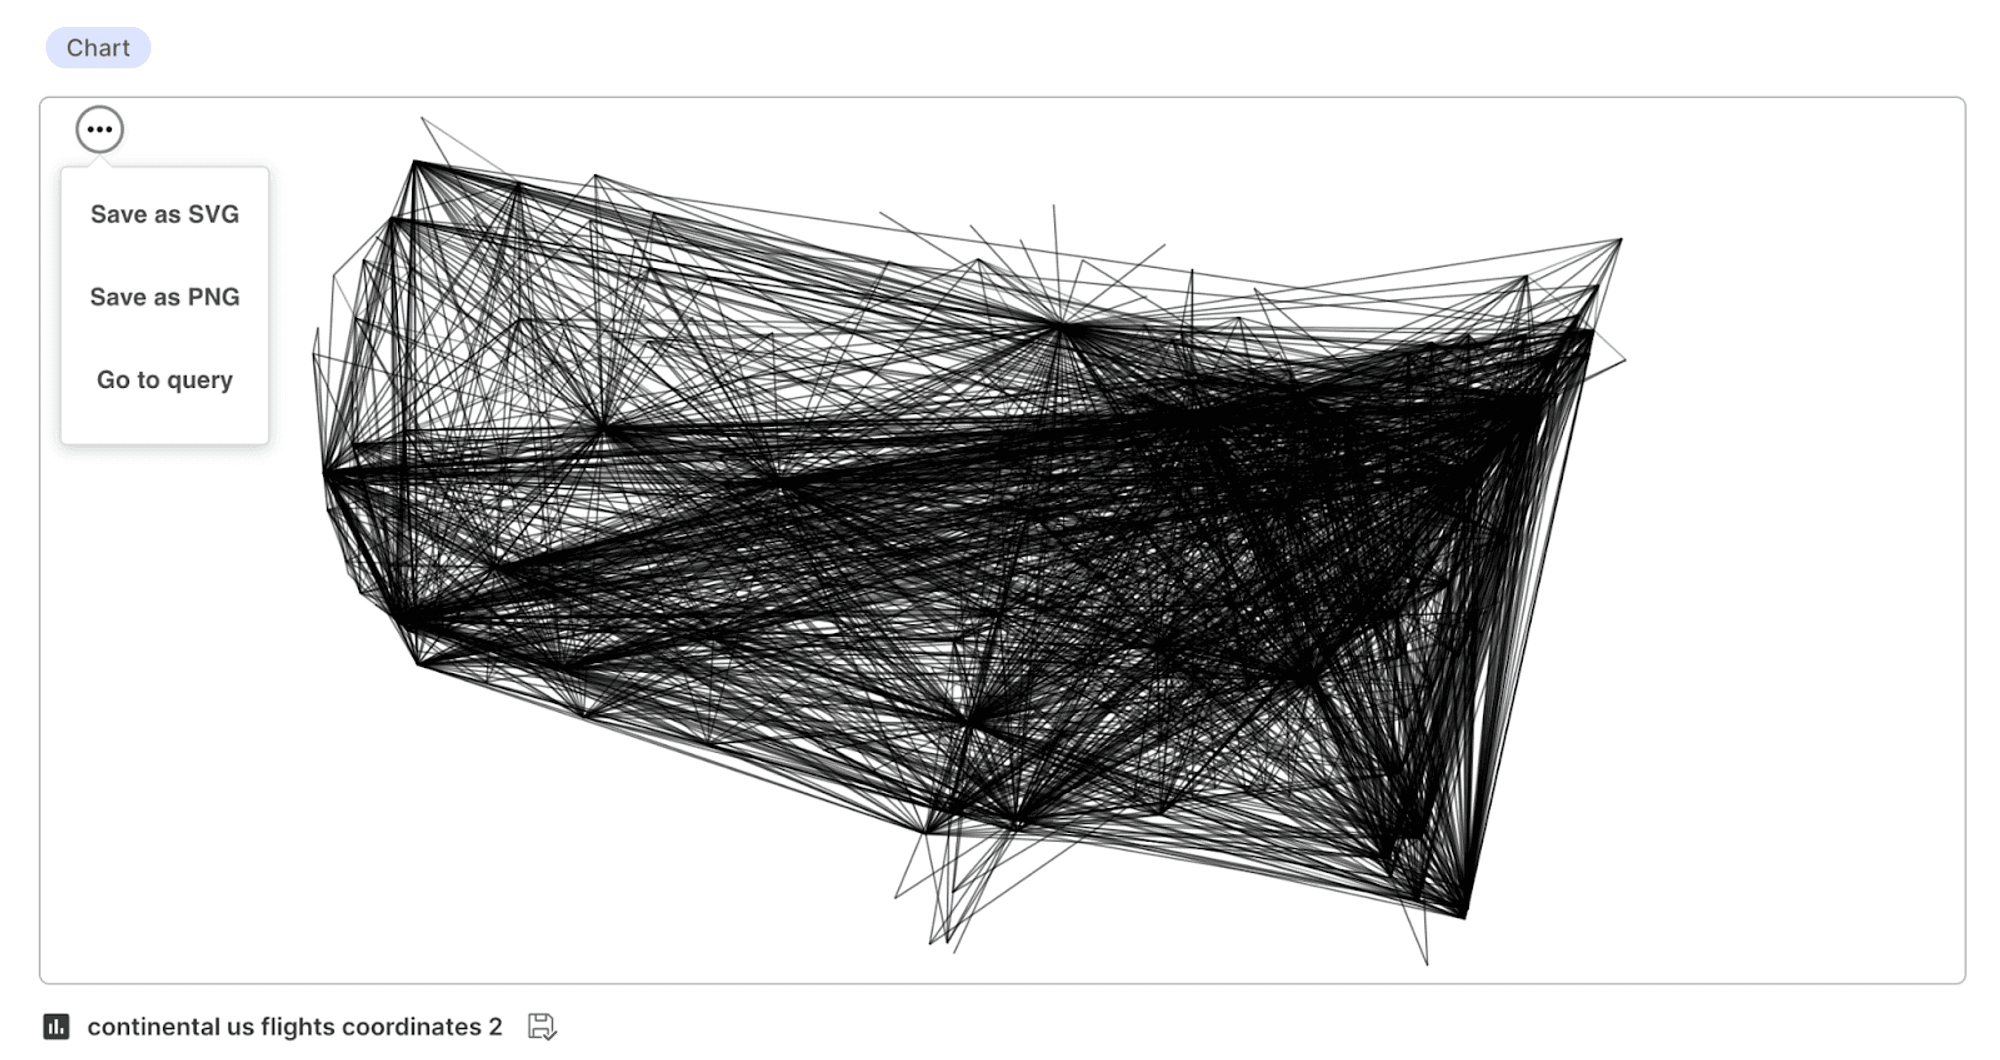
On the visual, in the upper left hand corner, by clicking on (…) you have the option to save and download the visual as a PNG or SVG file. If you click “Go to query”, you’ll see the data, SQL code, and a text explanation. To export into other applications, you can click to copy the SQL code or to export the data as a CSV file.
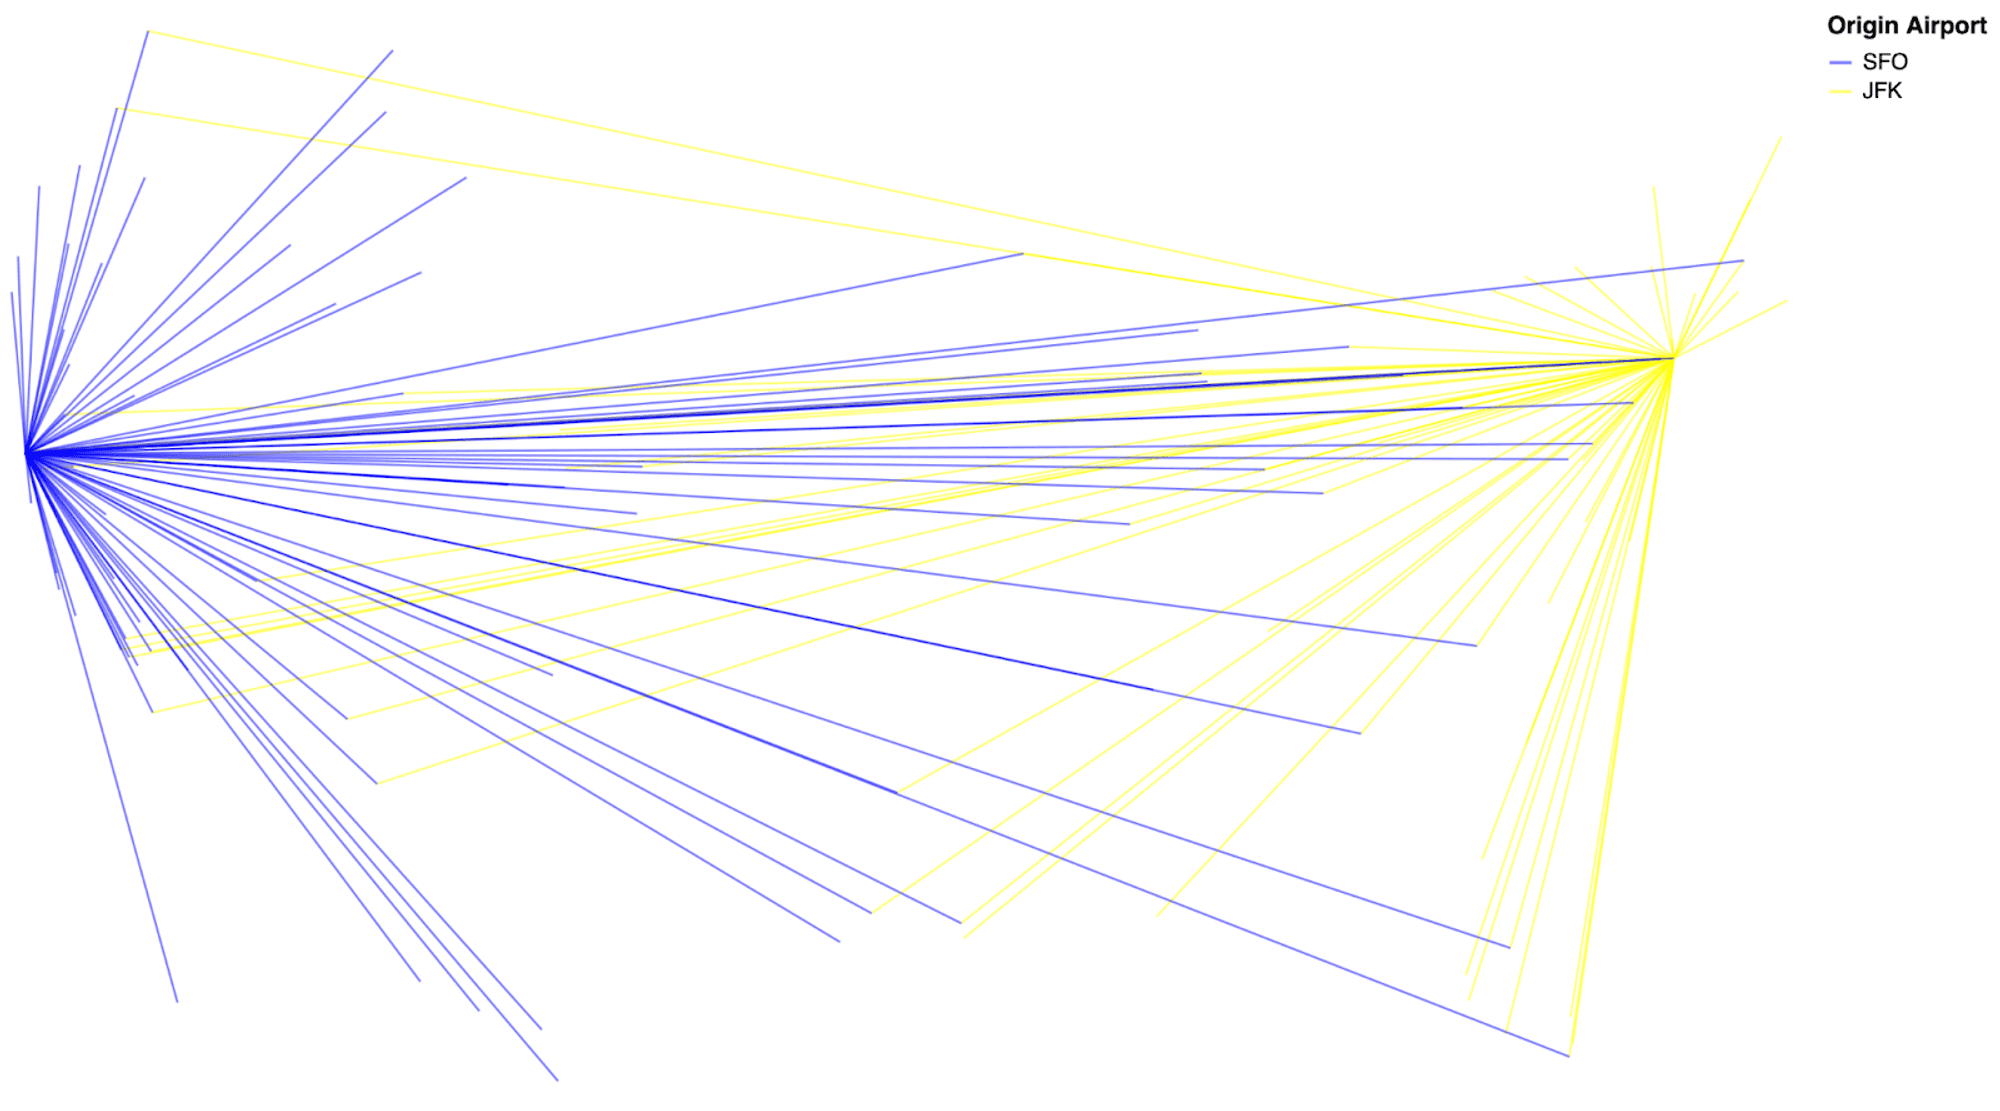
You can continue to explore the flight data with interactive questions. Let’s type “Display flights originating from SFO in blue and flights originating from JFK in yellow on top of a map of the continental United States.” Within seconds you will see the new visualization:
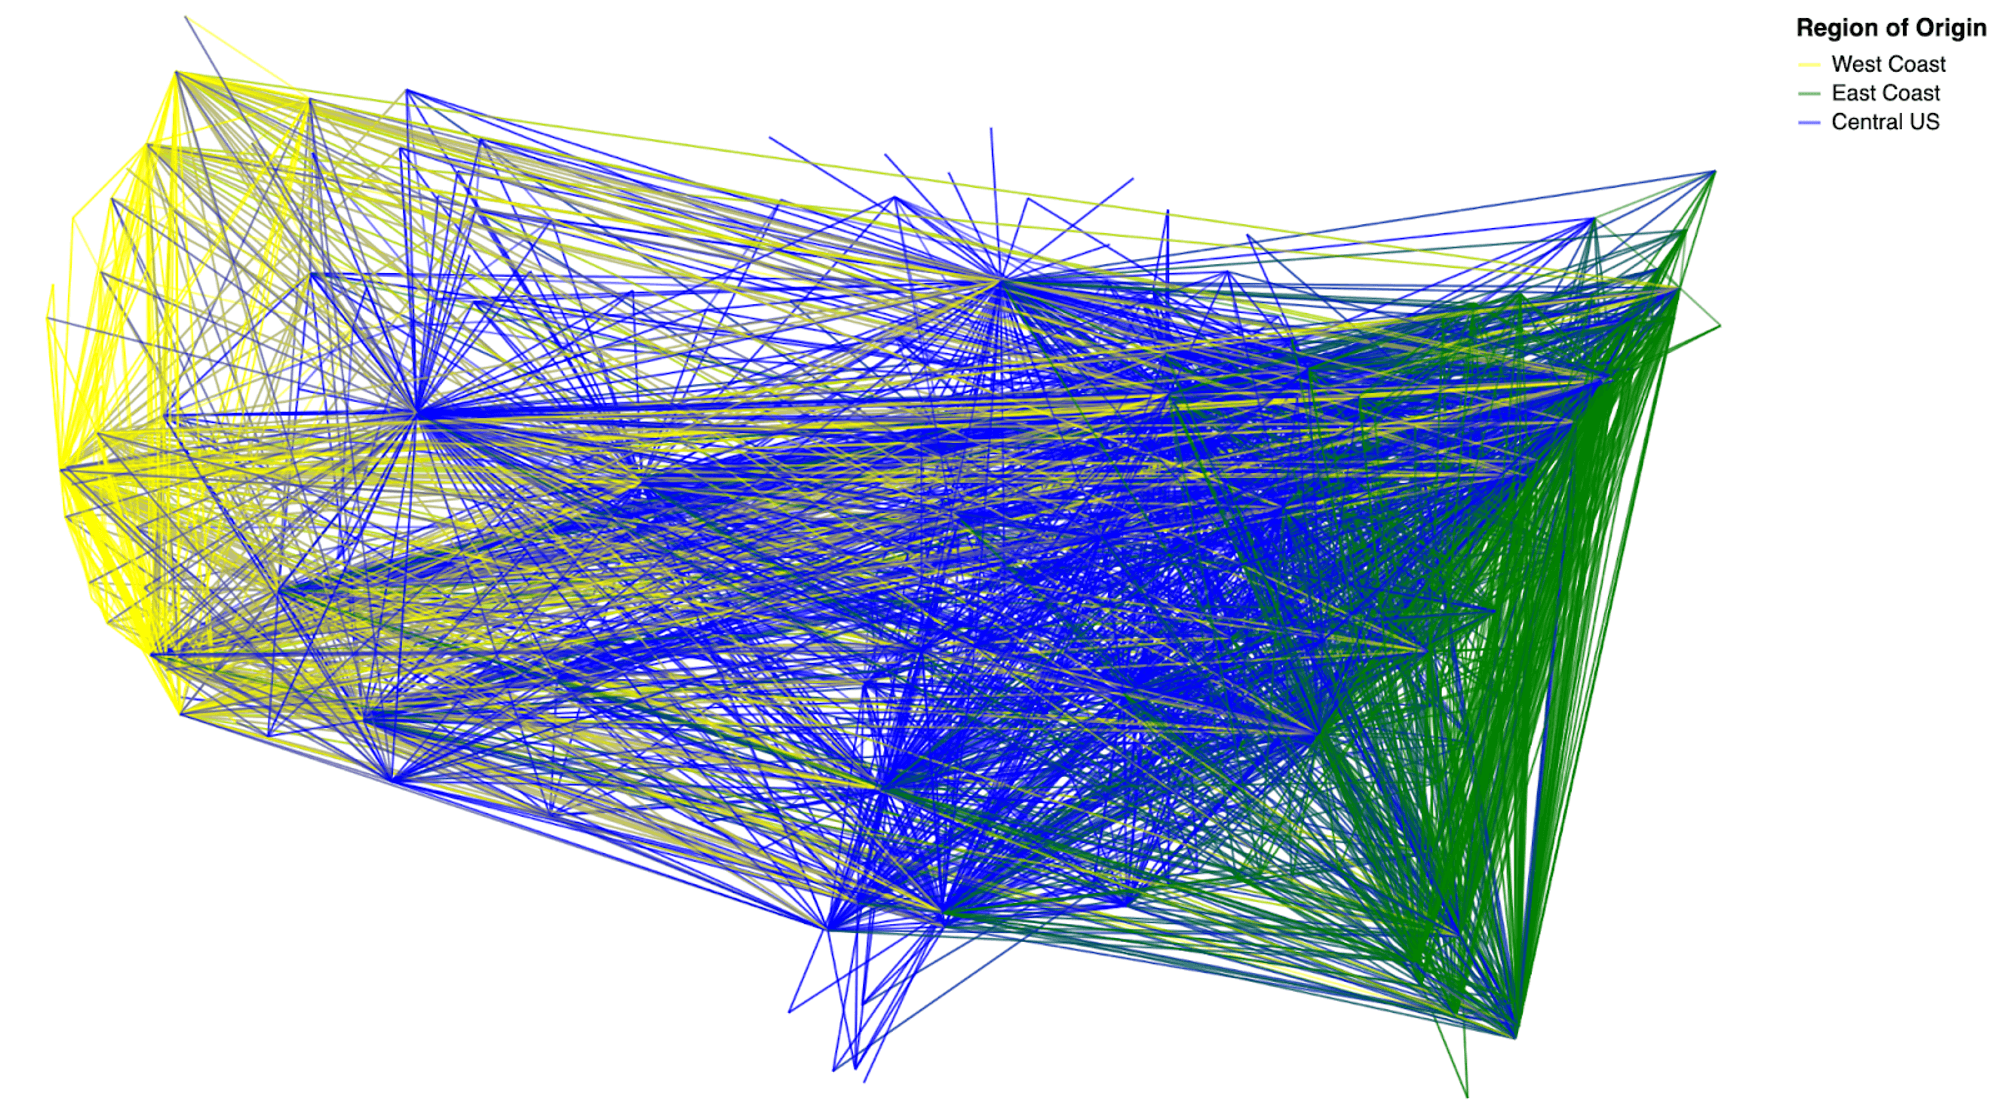
Next, to generate an example visualization similar to those of Aaron Koblin’s Flight Patterns project. Let’s type. “Show flights departing from the U.S. West coast in yellow and flights departing from the U.S. East coast in green. Show flights originating in the central United States in blue.”
Finally, we can type “Add a black background and show the map legend in white text.”
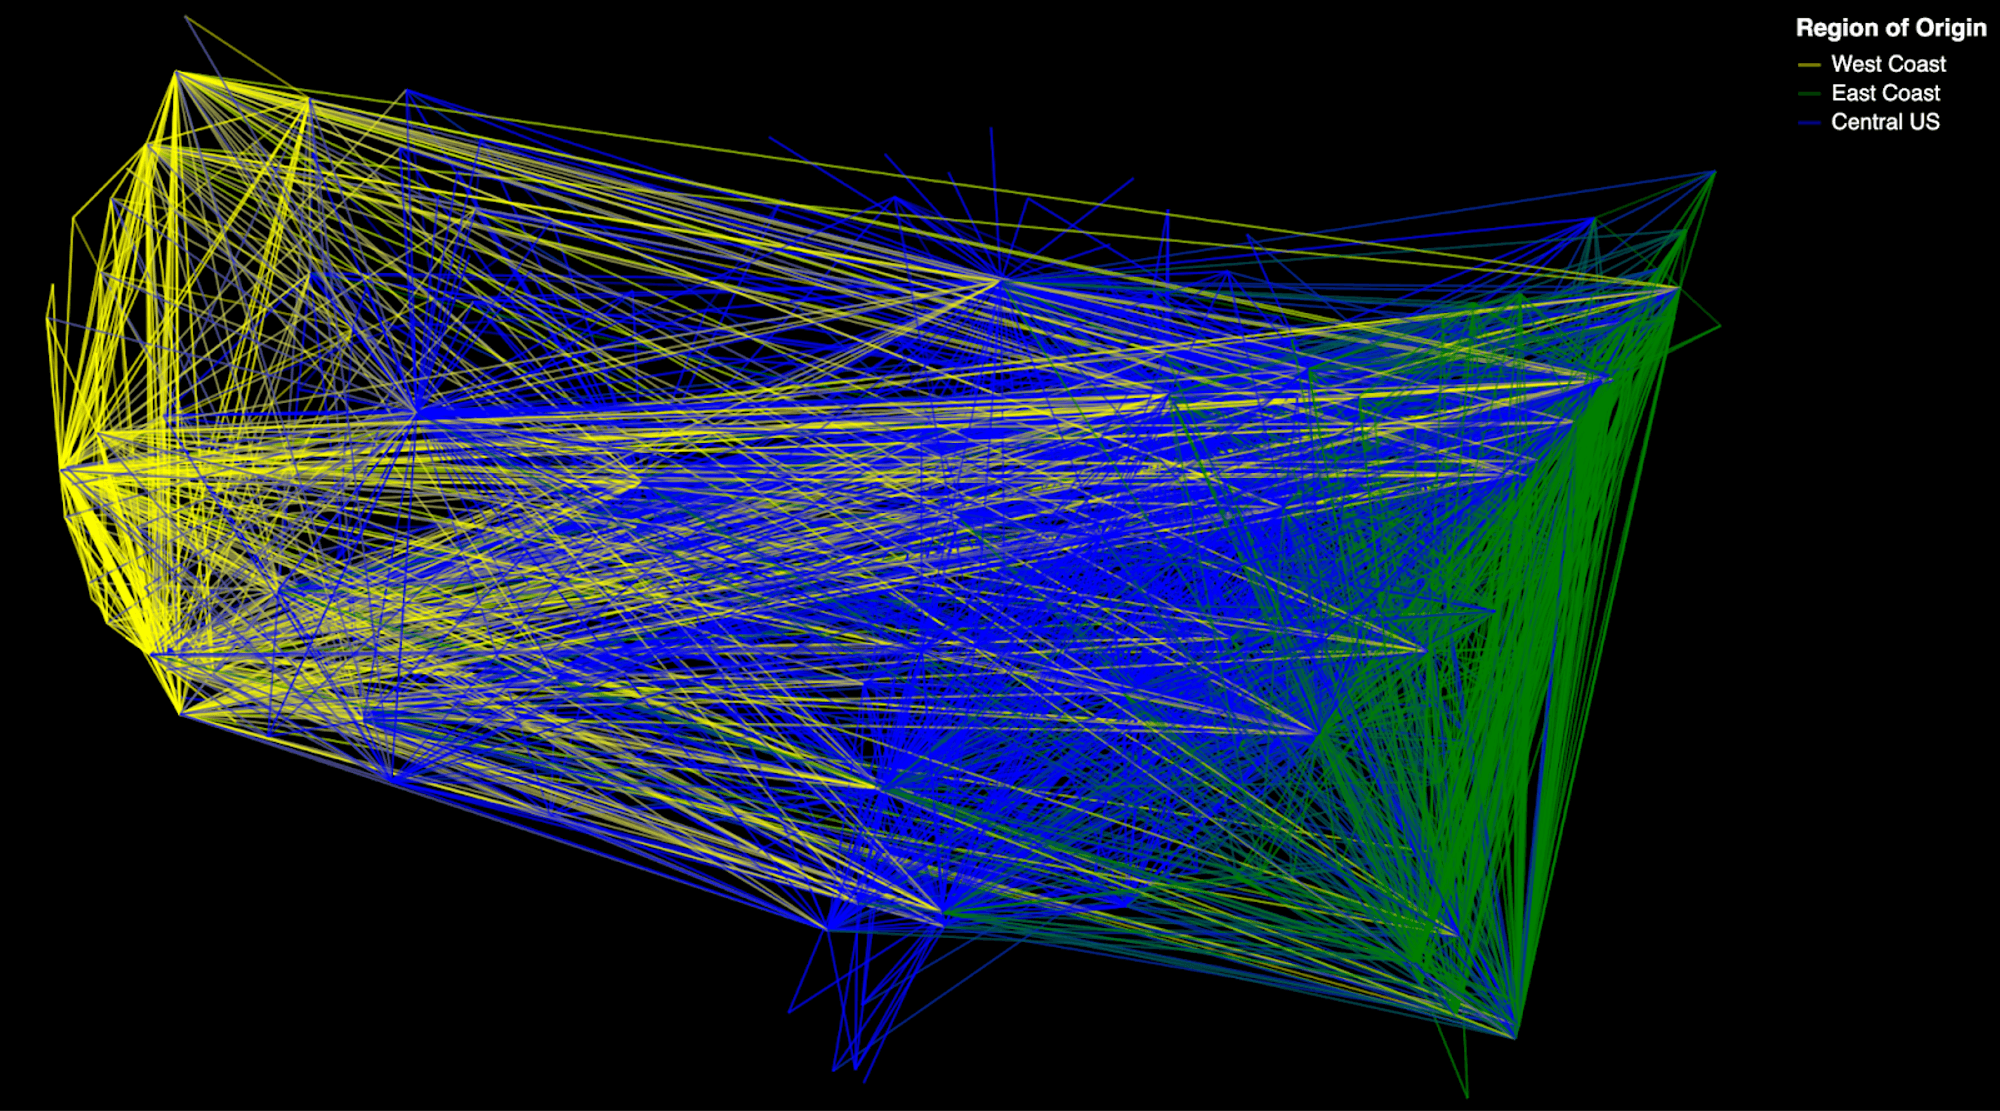
To recap, we have created a flight visualization through natural language instructions.
Next, I’ll explore natural language analytics by asking questions about the flight data. Patterns go beyond basic AI data visualization tools to allow you to chat with your data, not unlike how you chat with a coworker.
Let’s ask “What is the busiest U.S. airport?” Answer “Atlanta”.
When we ask “Which airport has the most flight departures that arrive in Atlanta?”, we receive the answer “Denver”.
If you are interested in exploring Patterns with your own data sets, in your free 30 day Patterns trial, you have the option to upload your own data or link to a cloud database. Patterns currently supports CSV files, Google BigQuery, MySQL, Redshift, Postgres, and Snowflake, with more options on the way.
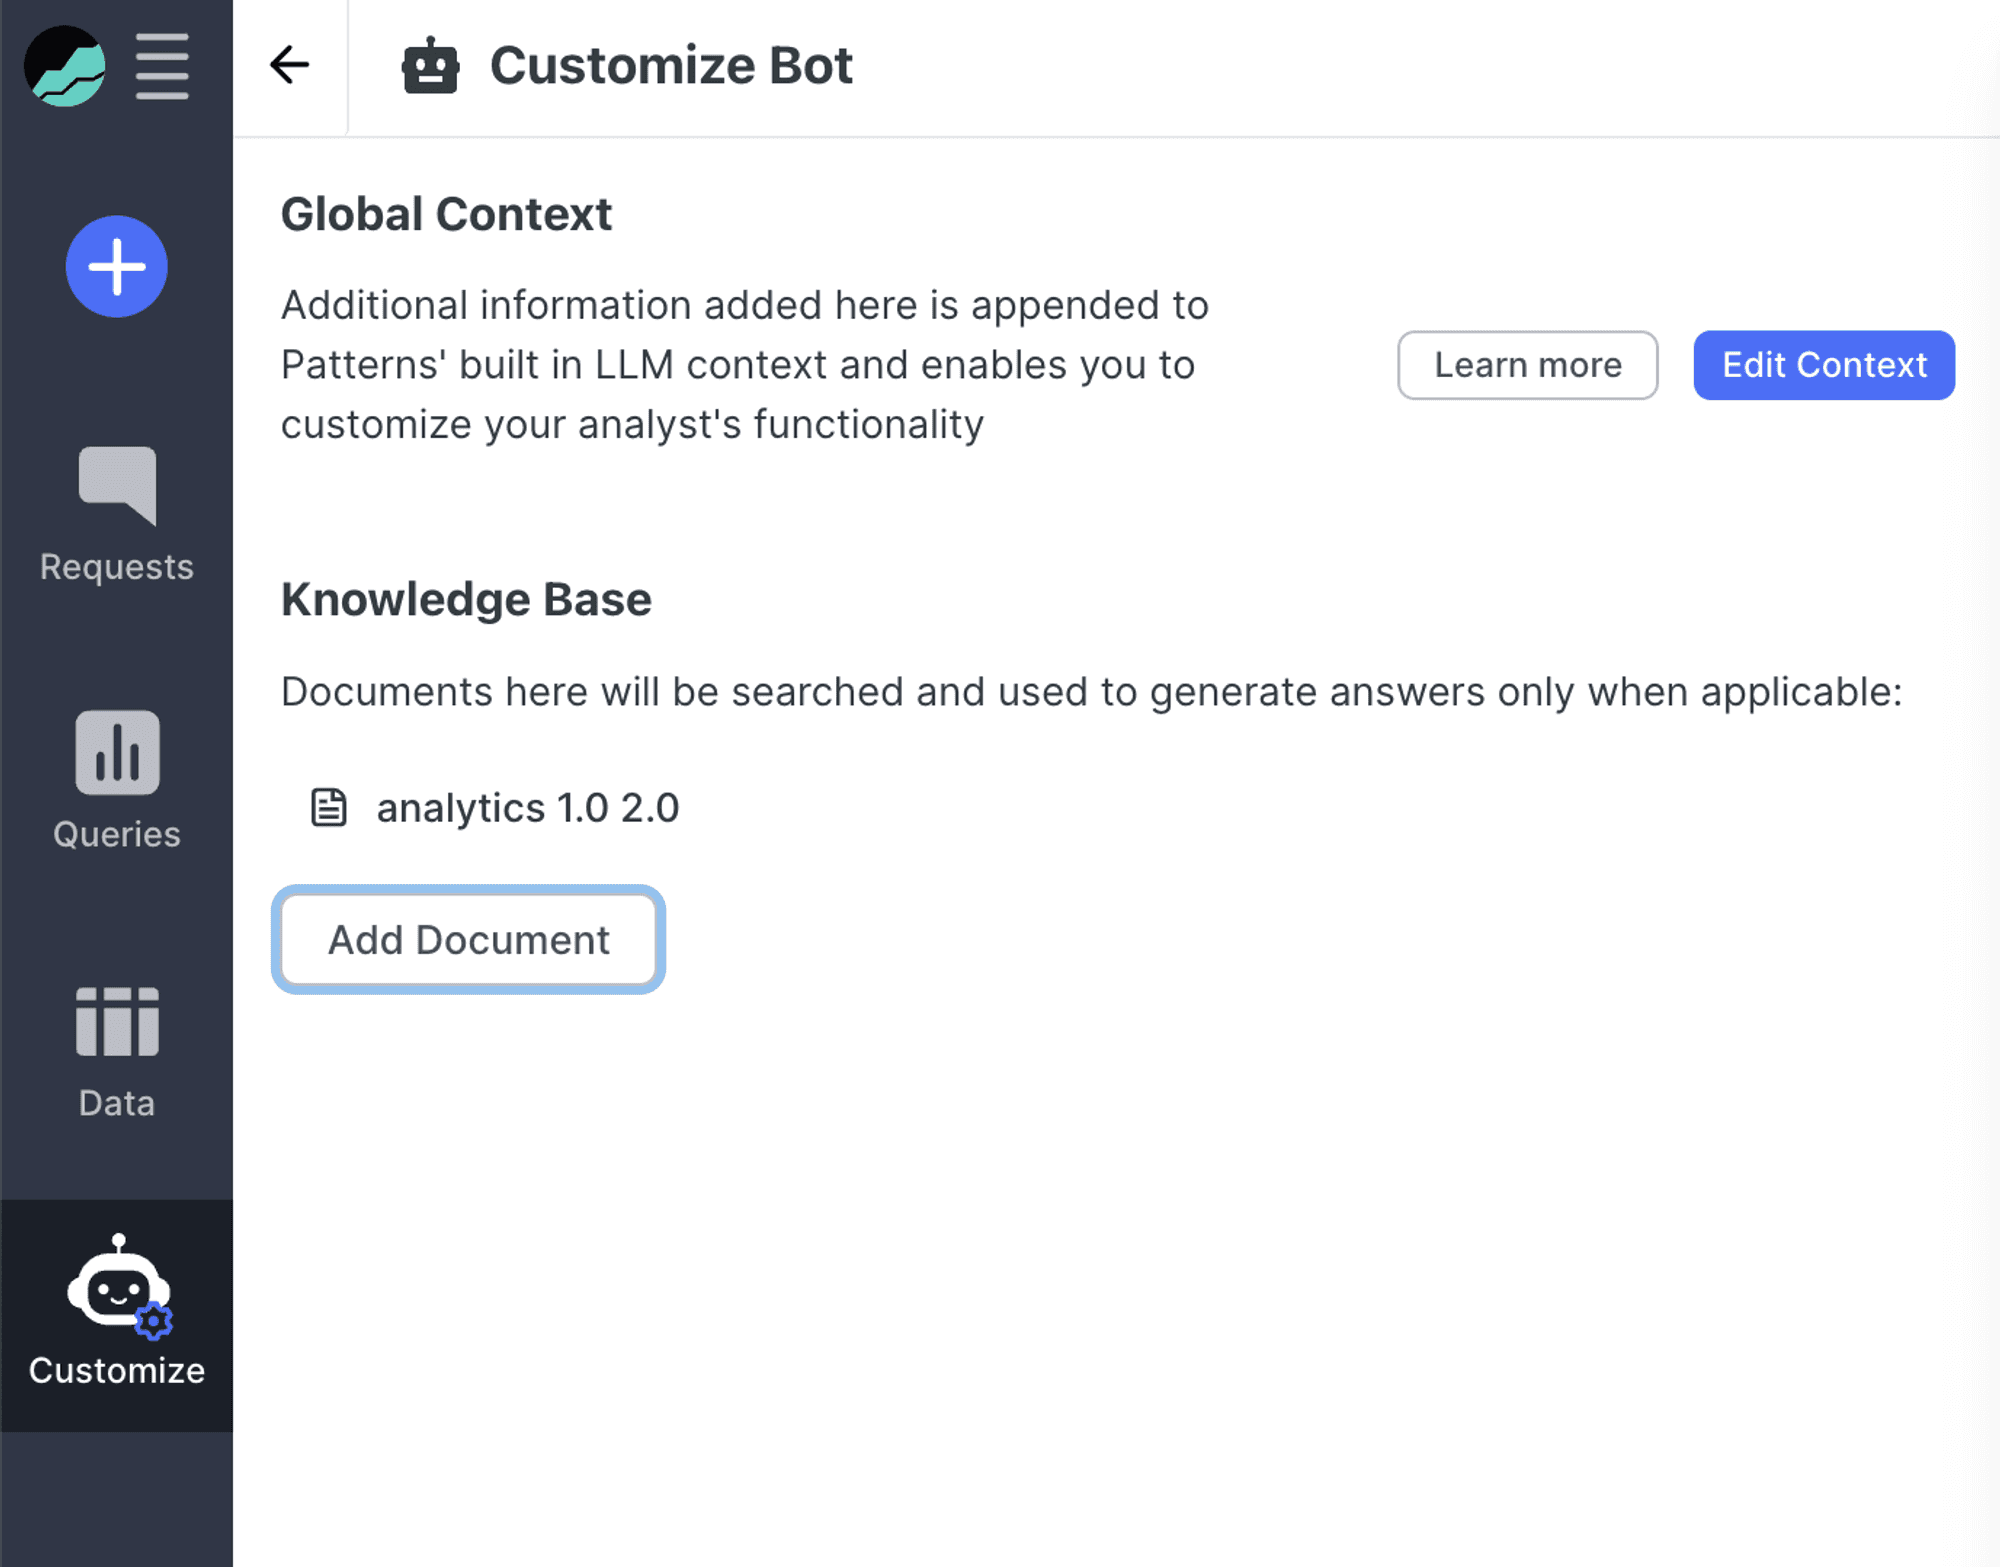
Finally, after clicking on the Customize icon, you have the option to upload documents to your Patterns instance to inform the large language model (LLM) about your organization and data. For example, you can upload a document that describes how your sales team organizes territories so that the Patterns bot can group data and visuals by your sales territory.
If you need help with adding context to Patterns instance, you can reach Patterns support by clicking on the question mark icon at the lower left of your Patterns screen to open a chat or by emailing support@patterns.app. The knowledge learned for Patterns context is not shared outside of your instance and is not fed back to the LLM available to other Patterns customers.
Introducing Patterns AI for Data Analytics
Patterns.app is designed to create a knowledge graph across your data architecture including databases, catalogs, semantic layer, and business intelligence. You’ll notice that there is much less busywork and much more AI automation for data integration and master data management than with generative business intelligence.
Unlike basic text to SQL AI, Patterns is designed to feel like a coworker. Patterns does this by training the bot on real verified queries, citations, and keeping humans in the loop for when the bot generates a low confidence score. The Patterns core intelligence layer provides crucial context to the OpenAI ChatGPT-4 large language model (LLM) using retrieval augmented generation (RAG) to combine information from prompts, global context, documents, tables, and analyses. For more on how it works, visit the Patterns.app introduction blog.
About Patterns.app
Founded by Chris Stanley, who previously led operations and data science leads at Square, Patterns graduated from Y Combinator and raised a US$6M Seed round in 2023. They are HQ’ed in Cow Hollow, San Francisco. In their product vision for AI business analytics, AI bots will be involved in every step of the data analytics workflow. Learn more at patterns.app and request your Patterns 30 day free trial here.